plenoptic.models.PortillaSimoncelli#
Note
This object is a torch.nn.Module. It therefore has all the methods and attributes
from that class, even though they are not documented here (to avoid cluttering this page).
- class plenoptic.models.PortillaSimoncelli(image_shape, n_scales=4, n_orientations=4, spatial_corr_width=7)[source]#
Bases:
ModulePortila-Simoncelli texture statistics.
The Portilla-Simoncelli (PS) texture statistics are a set of image statistics, first described in Portilla and Simoncelli, 2000 [2], that are proposed as a sufficient set of measurements for describing visual textures. That is, if two texture images have the same values for all PS texture stats, humans should consider them as members of the same family of textures.
The PS stats are computed based on the
SteerablePyramidFreq(Simoncelli and Freeman, 1995, [3]). They consist of the local auto-correlations, cross-scale (within-orientation) correlations, and cross-orientation (within-scale) correlations of both the pyramid coefficients and the local energy (as computed by those coefficients). Additionally, they include the first four global moments (mean, variance, skew, and kurtosis) of the image and down-sampled versions of that image. See the paper and notebook for more description.Changed in version 2.0.0: Default
spatial_corr_widthvalue changed from 9 to 7, in order to match the value used to generate the figures in the Portilla and Simoncelli, 2000 [2], paper.- Parameters:
- scales#
The names of the unique scales of coefficients in the pyramid, used for coarse-to-fine metamer synthesis.
- Type:
- Raises:
ValueError – If the height or width of
imagecannot be divided by 2n_scalestimes. This is necessary because of how the model handles multiscale representations.
References
Examples
Compute texture statistics of an image:
>>> import plenoptic as po
>>> img = po.data.reptile_skin()
>>> ps_model = po.models.PortillaSimoncelli(img.shape[2:])
>>> ps_model(img)
tensor([[[ 4.1716e-01, 5.4735e-02, ..., 4.7756e-03]]])
Visualize texture statistics:
>>> fig, axes = ps_model.plot_representation(ps_model(img))

Convert texture statistics into an easier-to-read format:
>>> representation_dict = ps_model.convert_to_dict(ps_model(img))
>>> representation_dict.keys()
odict_keys(['pixel_statistics', ..., 'var_highpass_residual'])
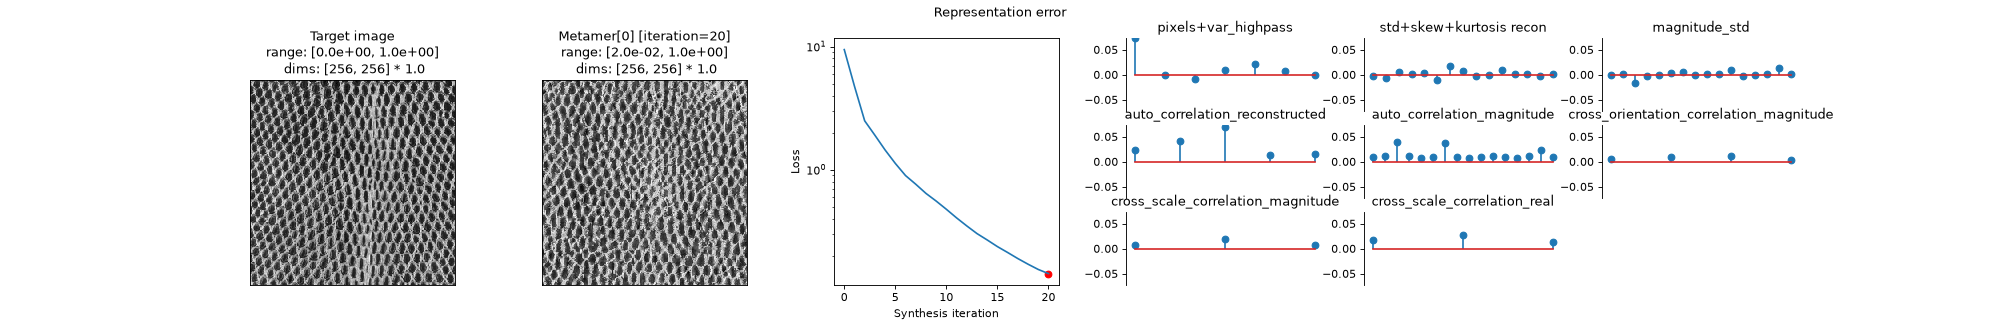
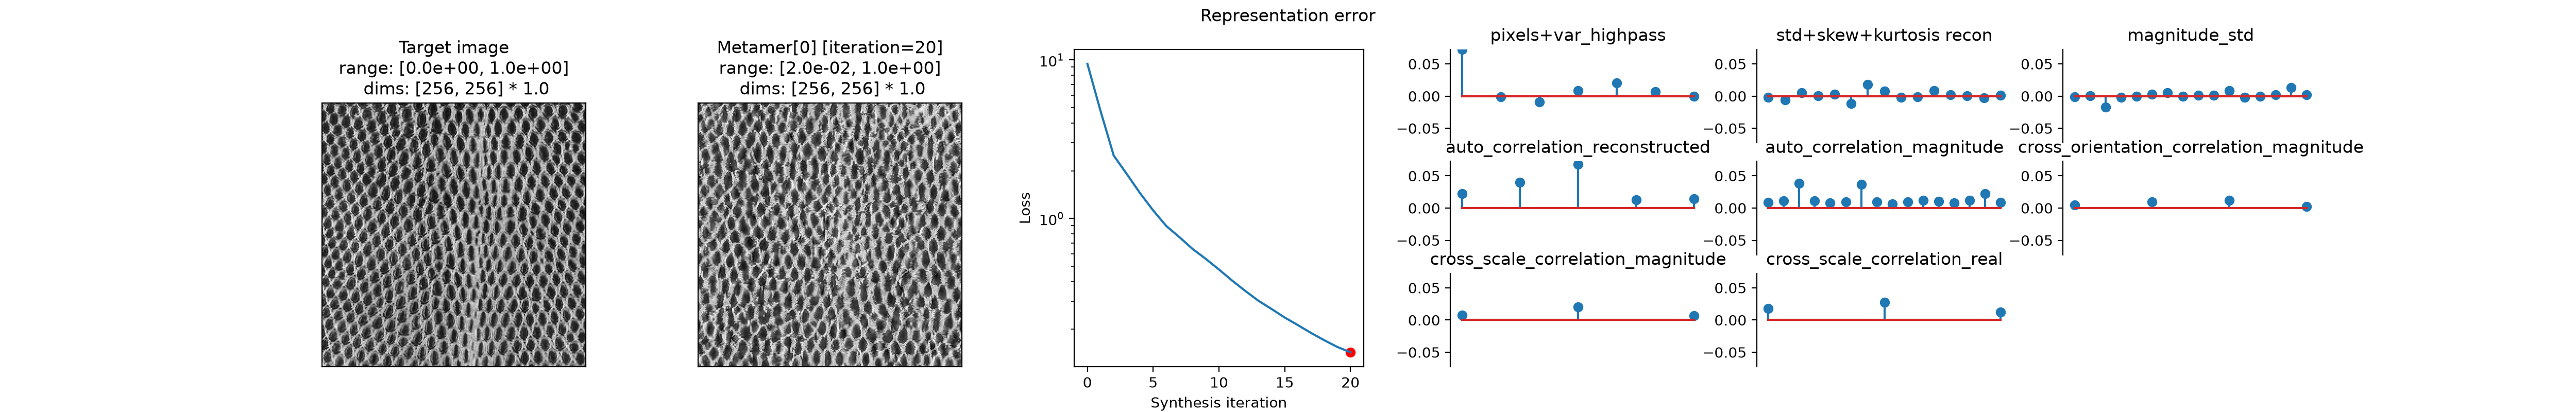
Synthesize a texture metamer:
>>> import plenoptic as po
>>> import matplotlib.pyplot as plt
>>> import torch
>>> img = po.data.reptile_skin()
>>> ps_model = po.models.PortillaSimoncelli(img.shape[2:])
>>> loss = po.loss.portilla_simoncelli_loss_factory(ps_model, img)
>>> met = po.Metamer(img, ps_model, loss_function=loss)
>>> opt_kwargs = {
...     "max_iter": 10,
...     "max_eval": 10,
...     "history_size": 100,
...     "line_search_fn": "strong_wolfe",
...     "lr": 1,
... }
>>> met.setup(optimizer=torch.optim.LBFGS, optimizer_kwargs=opt_kwargs)
>>> # Note that this isn't enough to run synthesis to completion,
>>> # just an example to demonstrate what synthesis looks like
>>> met.synthesize(max_iter=20)
>>> fig, axes = plt.subplots(1, 4, figsize=(25, 4), width_ratios=[1, 1, 1, 3])
>>> po.plot.imshow(img, ax=axes[0], title="Target image")
<Figure size ... with 4 Axes>
>>> axes[0].xaxis.set_visible(False)
>>> axes[0].yaxis.set_visible(False)
>>> po.plot.synthesis_status(met, fig=fig, axes_idx={"misc": 0})
<Figure size ...>
Methods
convert_to_dict(representation_tensor)Convert tensor of statistics to a dictionary.
convert_to_tensor(representation_dict)Convert dictionary of statistics to a tensor.
forward(image[, scales])Generate Texture Statistics representation of an image.
plot_representation(data[, ax, figsize, ...])Plot the representation in a human viewable format.
remove_scales(representation_tensor, ...)Remove statistics not associated with scales.
update_plot(axes, data[, batch_idx])Update the information in our representation plot.
- convert_to_dict(representation_tensor)[source]#
Convert tensor of statistics to a dictionary.
While the tensor representation is required by plenoptic’s synthesis objects, the dictionary representation is easier to manually inspect.
This dictionary will contain NaNs in its values: these are placeholders for the redundant statistics.
- Parameters:
representation_tensor (
Tensor) – 3d tensor of statistics.- Return type:
- Returns:
rep – Dictionary of representation, with informative keys.
- Raises:
ValueError – If
representation_tensorhas an unexpected number of elements. This can happen if some elements were manually removed fromrepresentation_tensor, if a non-Nonevalue was passed toforwardwhen computing it, or if it was computed using a different instantiation of the model.
See also
convert_to_tensorConvert dictionary representation to tensor.
Examples
>>> import plenoptic as po
>>> img = po.data.reptile_skin()
>>> portilla_simoncelli_model = po.models.PortillaSimoncelli(
...     img.shape[2:], n_scales=3
... )
>>> representation_tensor = portilla_simoncelli_model(img)
>>> representation_dict = portilla_simoncelli_model.convert_to_dict(
...     representation_tensor
... )
>>> # We will go through and examine each of these keys individually
>>> # Shape is (batch, channel, 6): first four moments plus min and max
>>> # of input image
>>> representation_dict["pixel_statistics"].shape
torch.Size([1, 1, 6])
>>> # Shape is (batch, channel, spatial_corr_width, spatial_corr_width,
>>> # n_orientations, n_scales)
>>> representation_dict["auto_correlation_magnitude"].shape
torch.Size([1, 1, 7, 7, 4, 3])
>>> # Shape is (batch, channel, n_scales+1)
>>> representation_dict["skew_reconstructed"].shape
torch.Size([1, 1, 4])
>>> # Shape is (batch, channel, n_scales+1)
>>> representation_dict["kurtosis_reconstructed"].shape
torch.Size([1, 1, 4])
>>> # Shape is (batch, channel, spatial_corr_width, spatial_corr_width,
>>> # n_scales+1)
>>> representation_dict["auto_correlation_reconstructed"].shape
torch.Size([1, 1, 7, 7, 4])
>>> # Shape is (batch, channel, n_scales+1)
>>> representation_dict["std_reconstructed"].shape
torch.Size([1, 1, 4])
>>> # Shape is (batch, channel, n_orientations, n_orientations, n_scales)
>>> representation_dict["cross_orientation_correlation_magnitude"].shape
torch.Size([1, 1, 4, 4, 3])
>>> # Shape is (batch, channel, n_orientations, n_scales)
>>> representation_dict["magnitude_std"].shape
torch.Size([1, 1, 4, 3])
>>> # Shape is (batch, channel, n_orientations, n_orientations, n_scales-1)
>>> representation_dict["cross_scale_correlation_magnitude"].shape
torch.Size([1, 1, 4, 4, 2])
>>> # Shape is (batch, channel, n_orientations, 2*n_orientations, n_scales-1)
>>> representation_dict["cross_scale_correlation_real"].shape
torch.Size([1, 1, 4, 8, 2])
>>> # Shape is (batch, channel, 1)
>>> representation_dict["var_highpass_residual"].shape
torch.Size([1, 1, 1])
- convert_to_tensor(representation_dict)[source]#
Convert dictionary of statistics to a tensor.
The output has shape (batch, channel, n_statistics), flattening and concatenating across all statistic classes. The dictionary representation may be easier to make sense of.
- Parameters:
representation_dict (
OrderedDict) – Dictionary of representation.- Return type:
- Returns:
rep – 3d tensor of statistics.
See also
convert_to_dictConvert tensor representation to dictionary.
Examples
>>> import plenoptic as po
>>> import torch
>>> img = po.data.reptile_skin()
>>> portilla_simoncelli_model = po.models.PortillaSimoncelli(img.shape[2:])
>>> representation_tensor = portilla_simoncelli_model(img)
>>> representation_dict = portilla_simoncelli_model.convert_to_dict(
...     representation_tensor
... )
>>> representation_tensor_new = portilla_simoncelli_model.convert_to_tensor(
...     representation_dict
... )
>>> torch.equal(representation_tensor, representation_tensor_new)
True
- forward(image, scales=None)[source]#
Generate Texture Statistics representation of an image.
Note that separate batches and channels are analyzed in parallel.
For any representation that contains info across scales, the scales always run from fine to coarse, representing all orientations at a given scale before moving on.
- Parameters:
image (
Tensor) – A 4d tensor (batch, channel, height, width) containing the image(s) to analyze.scales (
list[Literal['pixel_statistics'] |int|Literal['residual_lowpass','residual_highpass']] |None(default:None)) – Which scales to include in the returned representation. If None, we include all scales. Otherwise, can contain subset of values present in this model’sscalesattribute, and the returned tensor will then contain the subset corresponding to those scales.
- Return type:
- Returns:
representation_tensor – 3d tensor of shape (batch, channel, stats) containing the measured texture statistics.
- Raises:
ValueError – If
imageis not 4d or has a dtype other than float or complex.
Examples
>>> import plenoptic as po
>>> img = po.data.reptile_skin()
>>> portilla_simoncelli_model = po.models.PortillaSimoncelli(img.shape[2:])
>>> representation_tensor = portilla_simoncelli_model(img)
>>> representation_tensor.shape
torch.Size([1, 1, 710])
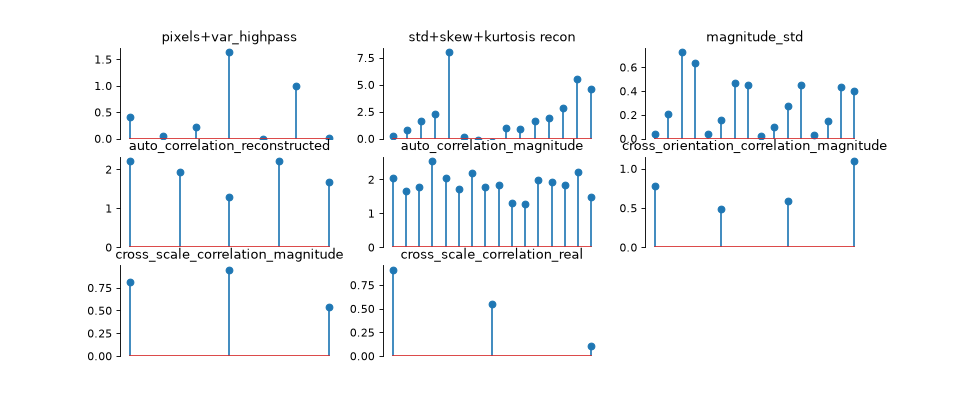
- plot_representation(data, ax=None, figsize=None, ylim=None, batch_idx=0, title=None)[source]#
Plot the representation in a human viewable format.
We plot the representation as stem plots with data separated out by statistic type.
This plots the representation of a single batch and averages over all channels in the representation.
We create the following axes:
pixels+var_highpass: marginal pixel statistics (first four moments, min, max) and variance of the residual highpass.
std+skew+kurtosis recon: the standard deviation, skew, and kurtosis of the reconstructed lowpass image at each scale
magnitude_std: the standard deviation of the steerable pyramid coefficient magnitudes at each orientation and scale.
auto_correlation_reconstructed: the auto-correlation of the reconstructed lowpass image at each scale (summarized using Euclidean norm).
auto_correlation_magnitude: the auto-correlation of the pyramid coefficient magnitudes at each scale and orientation (summarized using Euclidean norm).
cross_orientation_correlation_magnitude: the cross-correlations between each orientation at each scale (summarized using Euclidean norm)
If
self.n_scales > 1, we also have combination of the following, where all cross-correlations are summarized using Euclidean norm over the channel dimension:cross_scale_correlation_magnitude: the cross-correlations between the pyramid coefficient magnitude at one scale and the same orientation at the next-coarsest scale.
cross_scale_correlation_real: the cross-correlations between the real component of the pyramid coefficients and the real and imaginary components (at the same orientation) at the next-coarsest scale.
- Parameters:
data (
Tensor) – The data to show on the plot. Else, should look like the output ofself.forward(img), with the exact same structure (e.g., as returned bymetamer.representation_error()or another instance of this class).ax (
Axes|None(default:None)) – Axes where we will plot the data. If aplt.Axesinstance, will subdivide into 6 or 8 new axes (depending on self.n_scales). If None, we create a new figure.figsize (
tuple[float,float] |None(default:None)) – The size of the figure to create. Must beNoneif ax is notNone. If both figsize and ax areNone, then we setfigsize=(12, 15).ylim (
tuple[float,float] |Literal[False] |None(default:None)) – If not None, the y-limits to use for this plot. If None, we use the default, slightly adjusted so that the minimum is 0. If False, do not change y-limits.batch_idx (
int(default:0)) – Which index to take from the batch dimension (the first one).
- Return type:
- Returns:
fig – Figure containing the plot.
axes – List of 6 or 8 axes containing the plot (depending on
self.n_scales).
- Raises:
ValueError – If both
figsizeandaxare notNone.
Examples
>>> import plenoptic as po
>>> img = po.data.reptile_skin()
>>> portilla_simoncelli_model = po.models.PortillaSimoncelli(img.shape[2:])
>>> representation_tensor = portilla_simoncelli_model(img)
>>> fig, axes = portilla_simoncelli_model.plot_representation(
...     representation_tensor
... )

- remove_scales(representation_tensor, scales_to_keep)[source]#
Remove statistics not associated with scales.
For a given representation_tensor and a list of scales_to_keep, this attribute removes all statistics not associated with those scales.
Note that calling this method will always remove statistics.
- Parameters:
representation_tensor (
Tensor) – 3d tensor containing the measured representation statistics.scales_to_keep (
list[Literal['pixel_statistics'] |int|Literal['residual_lowpass','residual_highpass']]) – Which scales to include in the returned representation. Can contain subset of values present in this model’sscalesattribute, and the returned tensor will then contain the subset of the full representation corresponding to those scales.
- Return type:
- Returns:
limited_representation_tensor – Representation tensor with some statistics removed.
Examples
>>> import plenoptic as po
>>> img = po.data.reptile_skin()
>>> portilla_simoncelli_model = po.models.PortillaSimoncelli(img.shape[2:])
>>> representation_tensor = portilla_simoncelli_model(img)
>>> representation_tensor.shape
torch.Size([1, 1, 710])
>>> limited_representation_tensor = portilla_simoncelli_model.remove_scales(
...     representation_tensor, scales_to_keep=[0]
... )
>>> limited_representation_tensor.shape
torch.Size([1, 1, 181])
- update_plot(axes, data, batch_idx=0)[source]#
Update the information in our representation plot.
This is used for creating an animation of the representation over time. In order to create the animation, we need to know how to update the matplotlib Artists, and this provides a simple way of doing that. It relies on the fact that we’ve used
plot_representationto create the plots we want to update and so know that they’re stem plots.We take the axes containing the representation information (note that this is probably a subset of the total number of axes in the figure, if we’re showing other information, as done by
Metamer.animate), grab the representation from plotting and, since these are both lists, iterate through them, updating them to the values indataas we go.In order for this to be used by
FuncAnimation, we need to return Artists, so we return a list of the relevant artists, themarkerlineandstemlinesfrom theStemContainer.Currently, this averages over all channels in the representation.
- Parameters:
axes (
list[Axes]) – A list of axes to update. We assume that these are the axes created byplot_representationand so contain stem plots in the correct order.data (
Tensor) – The data to show on the plot. Else, should look like the output ofself.forward(img), with the exact same structure (e.g., as returned bymetamer.representation_error()or another instance of this class).batch_idx (
int(default:0)) – Which index to take from the batch dimension (the first one).
- Return type:
- Returns:
stem_artists – A list of the artists used to update the information on the stem plots.
Examples
This method is meant to be used by animation functions, so users won’t typically use this directly.
>>> import plenoptic as po
>>> img = po.data.reptile_skin()
>>> portilla_simoncelli_model = po.models.PortillaSimoncelli(img.shape[2:])
>>> representation_tensor = portilla_simoncelli_model.forward(img)
>>> fig, axes = portilla_simoncelli_model.plot_representation(
...     representation_tensor
... )
>>> new_img = po.data.einstein()
>>> new_representation_tensor = portilla_simoncelli_model.forward(new_img)
>>> stem_artists = portilla_simoncelli_model.update_plot(
...     axes, new_representation_tensor
... )