plenoptic.plot.histogram#
- plenoptic.plot.histogram(data, labels=None, batch_idx=0, channel_idx=None, ylim=False, xlim='range', xlabel='Values', ax=None, title='Histogram of tensor values', alpha=0.4, **kwargs)[source]#
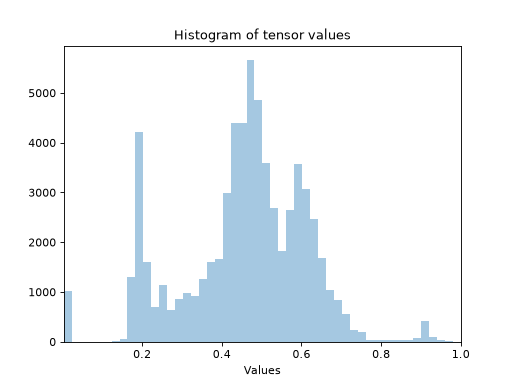
Plot histogram of values from tensor.
Intended use for this is to plot distributions of pixel values.
- Parameters:
data (
Tensor|list[Tensor]) – The data to plot. Must either be a single tensor or a list of tensors.labels (
str|list[str] |None(default:None)) – Labels to use for legend. Must matchdata: ifdatais a single tensor, must be a single string; ifdatais a list of tensors, must be a list of the same length. IfNone, no legend is created.batch_idx (
int|None(default:0)) – Which index to take from the batch (first) dimension. IfNone, we use all batches.channel_idx (
int|None(default:None)) – Which index to take from the channel (second) dimension. IfNone, we use all channels.ylim (
tuple[float,float] |Literal[False] (default:False)) – If tuple, the ylimit to set for this axis. IfFalse, we leave it untouched.xlim (
tuple[float,float] |Literal[False,'range'] (default:'range')) – If"range", set the xlimits to the range across plotted data. If tuple, the xlimit to set for this axis. IfFalse, we leave it untouched.xlabel (
str|Literal[False] (default:'Values')) – Label to put on the x-axis.ax (
Axes|None(default:None)) – Pre-existing axes for plot. IfNone, we callmatplotlib.pyplot.gca.title (
str(default:'Histogram of tensor values')) – Title for the axis.alpha (
float(default:0.4)) – Alpha value for the histogram bars.**kwargs (
Any) – Passed tomatplotlib.pyplot.hist.
- Return type:
- Returns:
ax – Created axes.
- Raises:
ValueError – If
labelsanddataare both lists but have different lengths
See also
synthesis_histogramUse this function to plot histogram of values from a synthesis object.
Examples
>>> import plenoptic as po
>>> import torch
>>> img = po.data.einstein()
>>> po.plot.histogram(img)
<Axes: ... 'Histogram of tensor values'...>
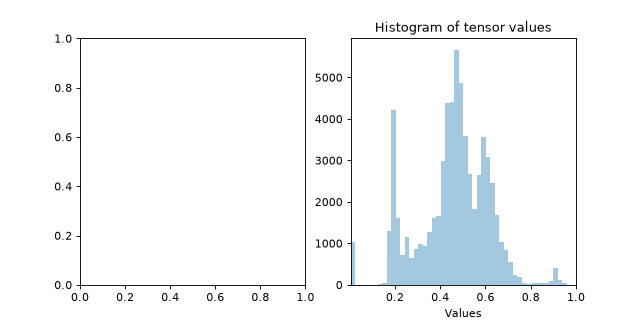
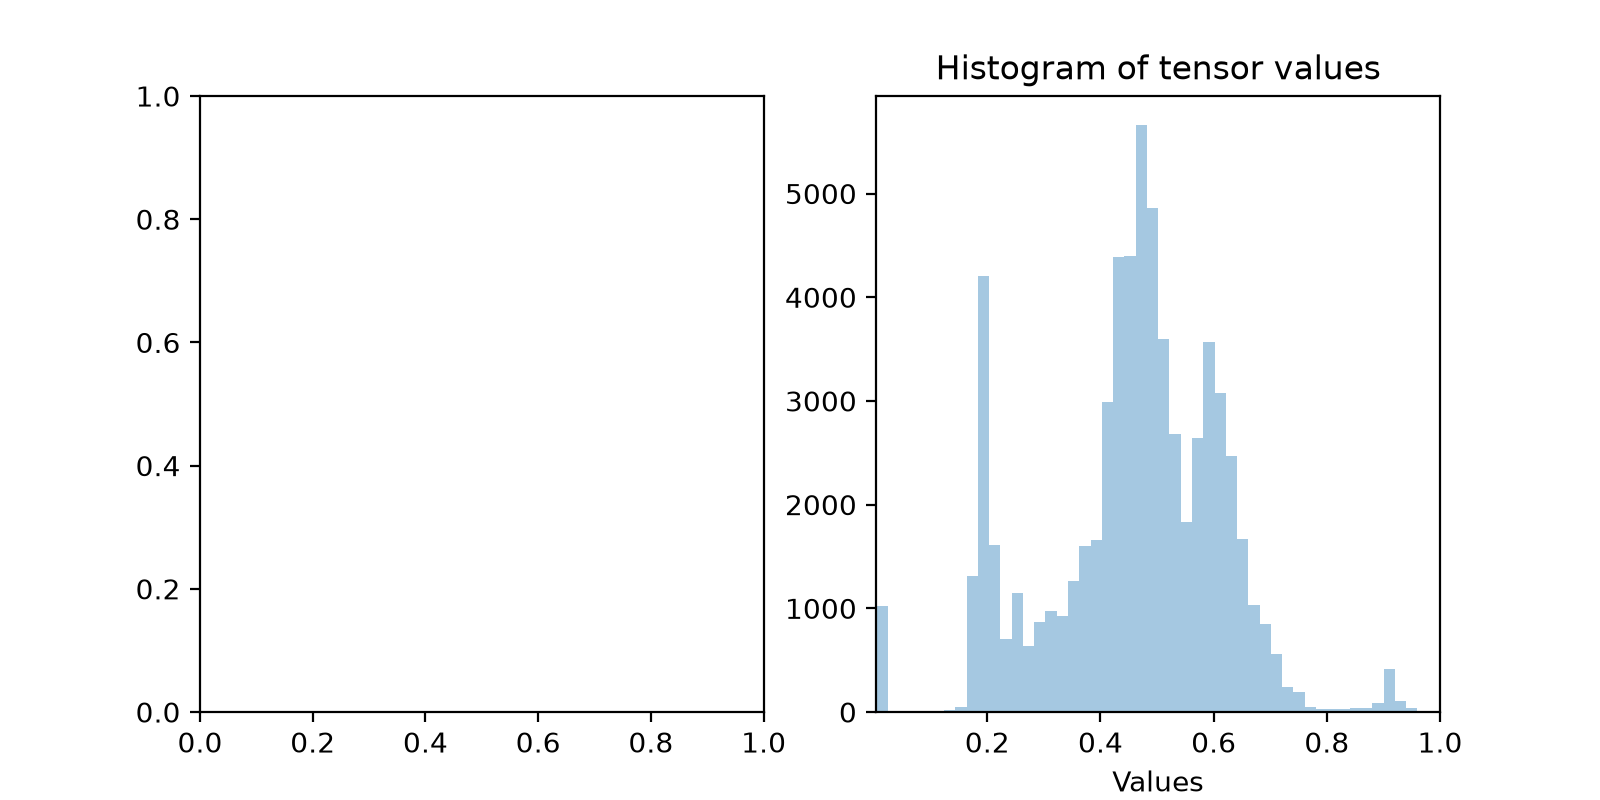
Plot on an existing axis:
>>> fig, axes = plt.subplots(1, 2, figsize=(8, 4))
>>> po.plot.histogram(img, ax=axes[1])
<Axes: ... 'Histogram of tensor values'...>