plenoptic.plot.stem_plot#
- plenoptic.plot.stem_plot(data, ax=None, title='', ylim=None, xvals=None, **kwargs)[source]#
Create a simple stem plot.
This plots the data, baseline, cleans up the axis, and sets the title.
Helper function for
plot_representation.If
xvals=None, stem plot will have a baseline that covers the entire range of the data. In order to break that up visually (so there’s a line from 0 to 9, from 10 to 19, etc) passxvalsseparately.- Parameters:
data (
Tensor) – The data to plot (as a stem plot).ax (
Axes|None(default:None)) – The axis to plot the data on. IfNone, we plot on the current axis (grabbed withmatplotlib.pyplot.gca).title (
str|None(default:'')) – The title to put on the axis. IfNone, we don’t callax.set_title(useful if you want to avoid changing the title on an existing plot).ylim (
tuple|None|Literal[False] (default:None)) – If a tuple, the y-limits to use for this plot. IfNone, we use the original limits, slightly adjusted so that the minimum is 0. IfFalse, we do not change y-limits.xvals (
tuple[list[float],list[float]] |None(default:None)) – A 2-tuple of lists, containing the start (xvals[0]) and stop (xvals[1]) x values for plotting. IfNone, baseline will cover full range.**kwargs (
Any) – Passed tomatplotlib.pyplot.stem.
- Return type:
- Returns:
ax – The axis with the plot.
Examples
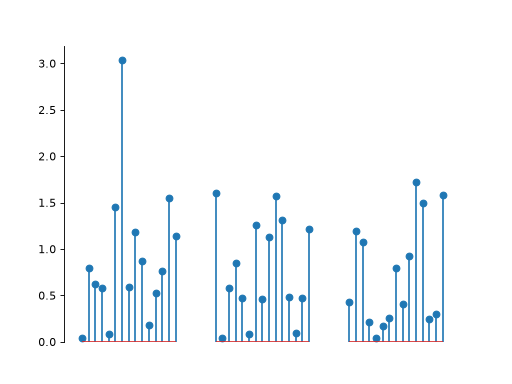
We allow for breaks in the baseline value if we want to visually break up the plot, as we see below.
>>> import plenoptic as po
>>> import numpy as np
>>> # if ylim=None, as in this example, the minimum y-valuewill get
>>> # set to 0, so we want to make sure our values are all positive
>>> y = np.abs(np.random.randn(55))
>>> y[15:20] = np.nan
>>> y[35:40] = np.nan
>>> # we want to draw the baseline from 0 to 14, 20 to 34, and 40 to
>>> # 54, everywhere that we have non-NaN values for y
>>> xvals = ([0, 20, 40], [14, 34, 54])
>>> po.plot.stem_plot(y, xvals=xvals)
<Axes: >
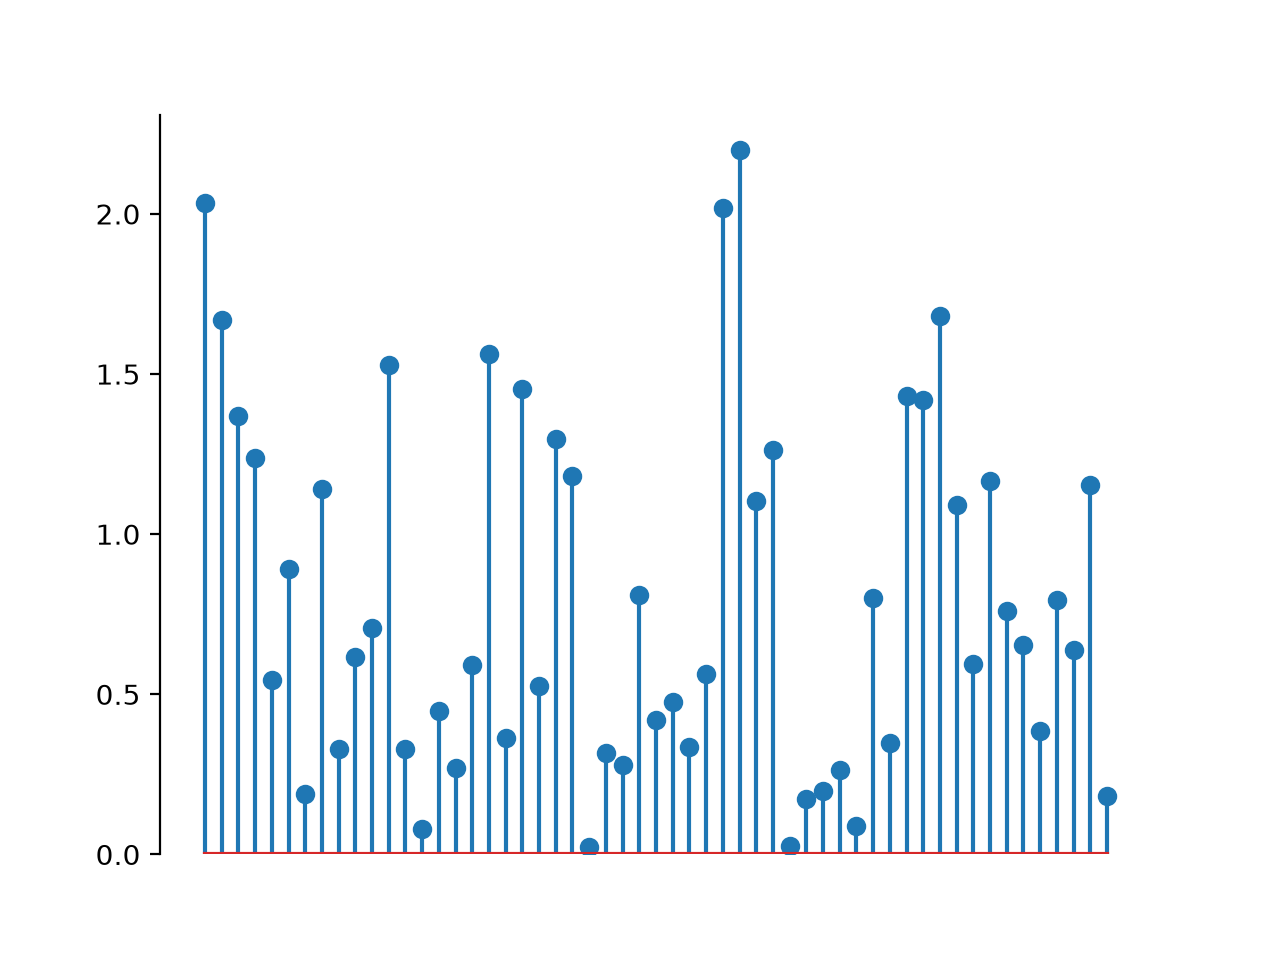
If we don’t care about breaking up the x-axis, you can set
xvals=None. In this case, this function will just clean up the plot a little bit.>>> # if ylim=None, as in this example, the minimum y-value will get >>> # set to 0, so we want to make sure our values are all positive >>> y = np.abs(np.random.randn(55)) >>> po.plot.stem_plot(y) <Axes: >
