plenoptic.plot.metamer_representation_error#
- plenoptic.plot.metamer_representation_error(metamer, batch_idx=0, iteration=None, ylim=None, ax=None, as_rgb=False, **kwargs)[source]#
Plot representation error showing how close we are to convergence.
We plot
_representation_error(metamer, iteration). For more details, seeplenoptic.plot.plot_representation.- Parameters:
metamer (
Metamer) – Metamer object whose synthesized metamer we want to display.batch_idx (
int(default:0)) – Which index to take from the batch dimension.iteration (
int|None(default:None)) – Which iteration to display. IfNone, we show the most recent one. Negative values are also allowed. Ifiteration!=Noneandmetamer.store_progress>1(that is, the metamer was not cached on every iteration), then we show the cached metamer from the nearest iteration.ylim (
tuple[float,float] |None|Literal[False] (default:None)) – IfylimisNone, we sets the axes’ y-limits to be(-y_max, y_max), wherey_max=np.abs(data).max(). If it’sFalse, we do nothing. If a tuple, we use that range.ax (
Axes|None(default:None)) – Pre-existing axes for plot. IfNone, we callmatplotlib.pyplot.gca.as_rgb (
bool(default:False)) – The representation can be image-like with multiple channels, and we have no way to determine whether it should be represented as an RGB image or not, so the user must set this flag to tell us. It will be ignored if the response doesn’t look image-like or if the model has its ownplot_representation_error()method. Else, it will be passed toimshow, see that methods docstring for details.**kwargs (
Any) – Passed tometamer.model.forward.
- Return type:
- Returns:
axes – List of created axes.
- Raises:
IndexError – If
iterationtakes an illegal value.- Warns:
UserWarning – If the iteration for the metamer used to compute the error is not the same as the argument
iteration(because e.g., you setiteration=3butmetamer.store_progress=2).
See also
plot_representationFunction used by this one to plot representation.
synthesis_statusCreate a figure combining this with other axis-level plots to summarize synthesis status at a given iteration.
synthesis_animateCreate a video animating this and other axis-level plots changing over the course of synthesis.
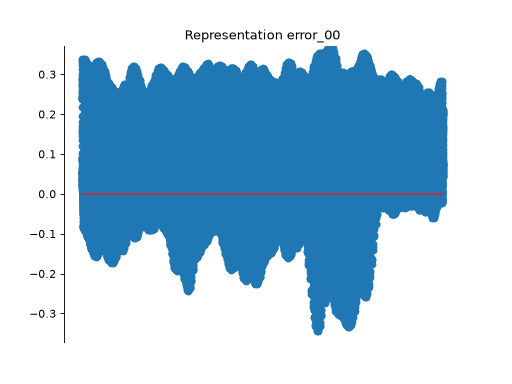
Examples
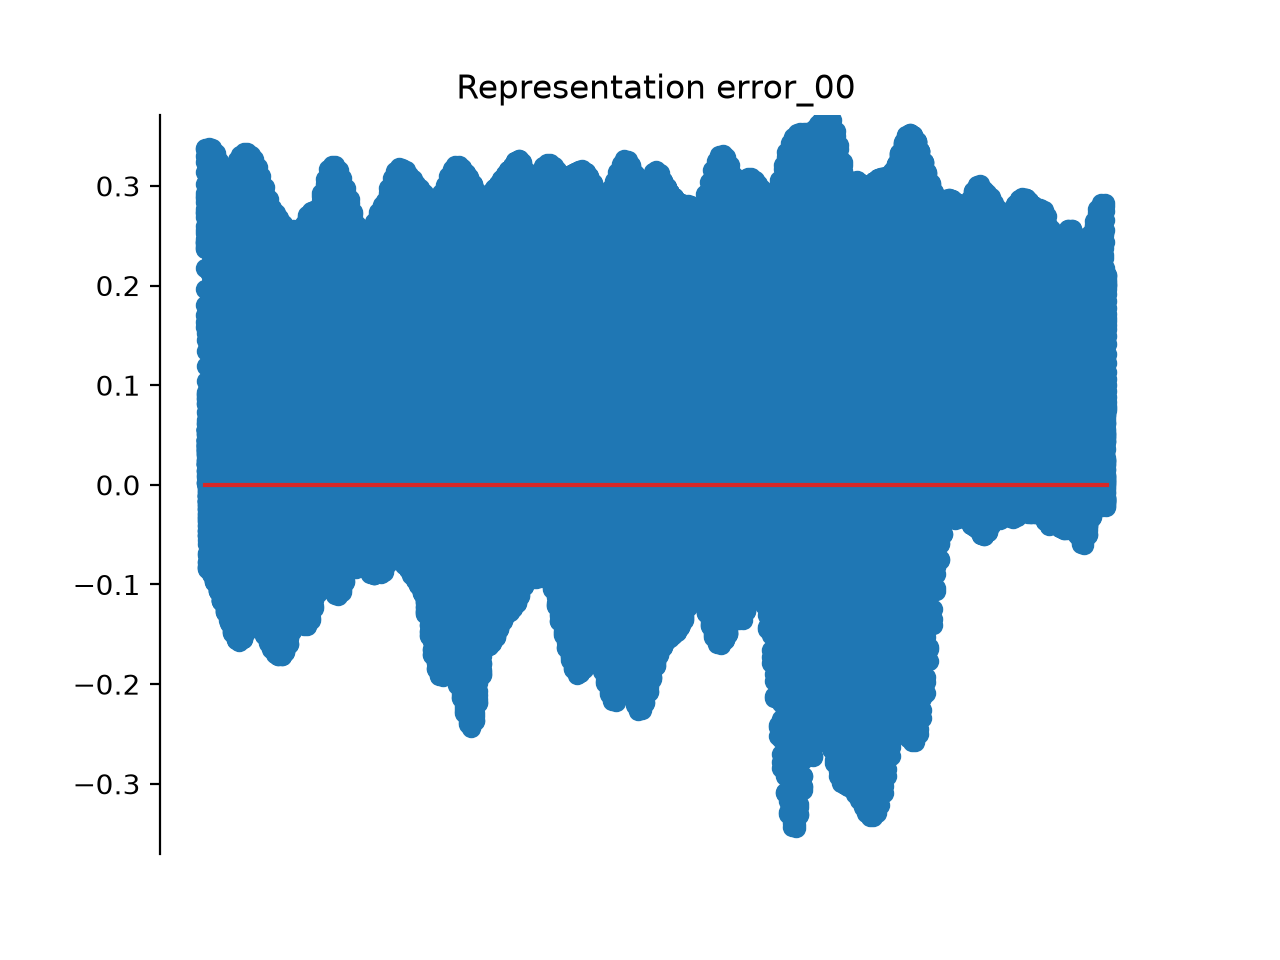
>>> import plenoptic as po
>>> import torch
>>> img = po.data.einstein()
>>> model = po.models.Gaussian(30).eval()
>>> po.remove_grad(model)
>>> met = po.Metamer(img, model)
>>> met.to(torch.float64)
>>> met.load(po.data.fetch_data("example_metamer_gaussian.pt"))
>>> po.plot.metamer_representation_error(met)
[<Axes: title=...Representation error...>]

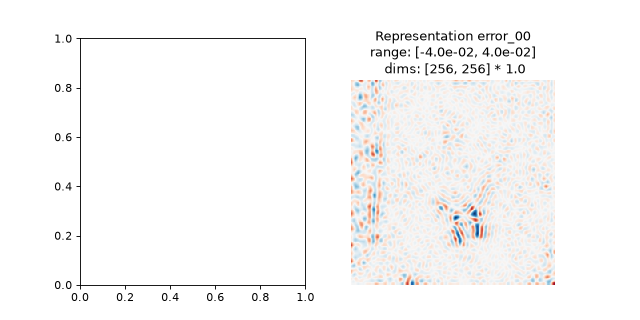
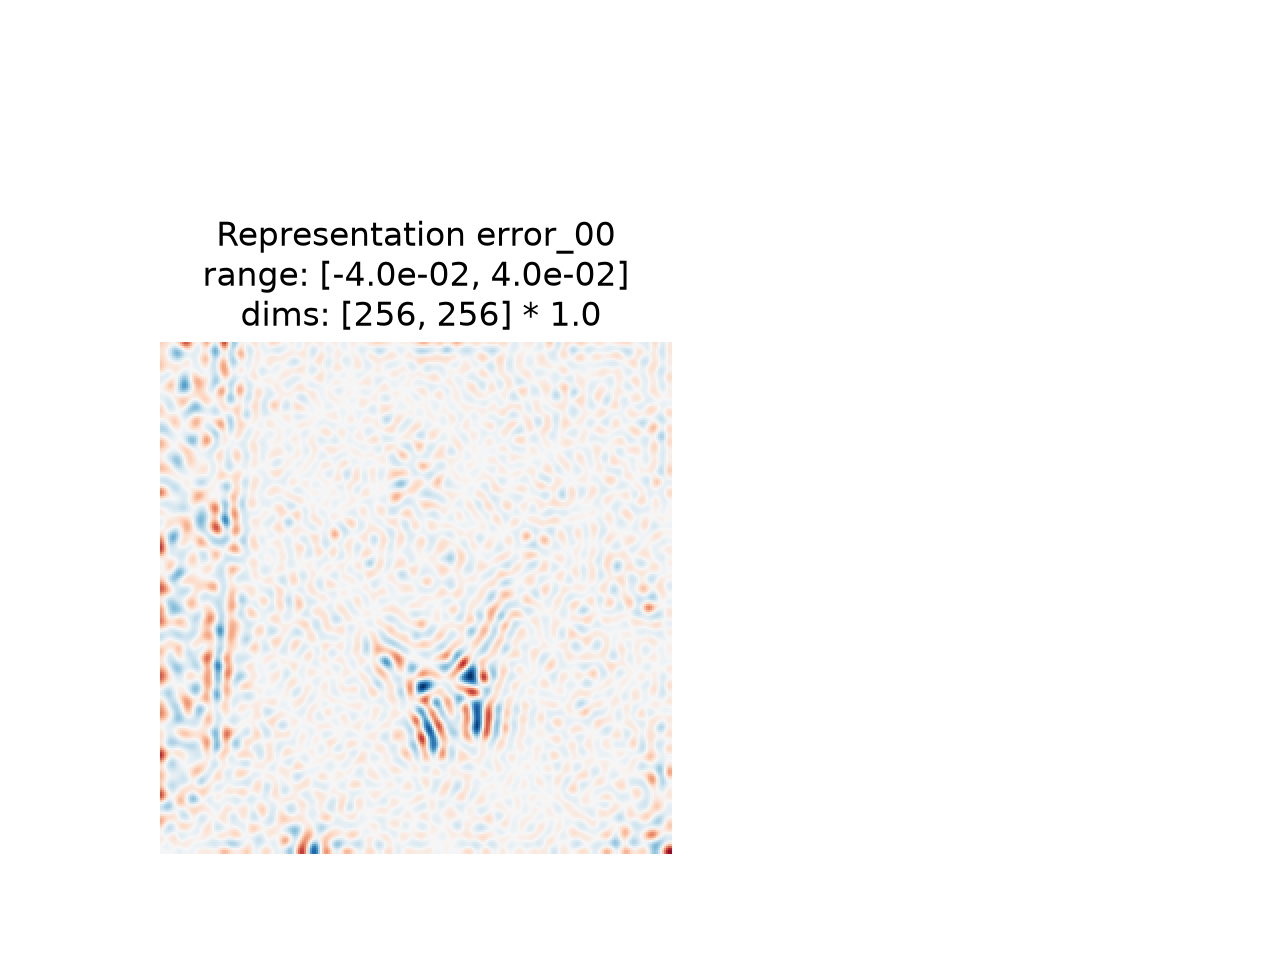
Plot on an existing axis:
>>> import matplotlib.pyplot
>>> fig, axes = plt.subplots(1, 2, figsize=(8, 4))
>>> po.plot.metamer_representation_error(met, ax=axes[1])
[<Axes: title=...Representation error...>]
The function uses
plot_representation, which switches betweenimshowandstem_plotbased on the shape of the model’s output:>>> # Flatten the last two dimensions of the output, so it looks like a vector. >>> class TestModel(po.models.Gaussian): ... def __init__(self, *args, **kwargs): ... super().__init__(*args, **kwargs) ... ... def forward(self, x): ... return super().forward(x).flatten(-2) >>> model = TestModel(30).eval() >>> po.remove_grad(model) >>> met = po.Metamer(img, model) >>> met.to(torch.float64) >>> met.synthesize(5) >>> po.plot.metamer_representation_error(met) [<Axes: title=...Representation error...>]
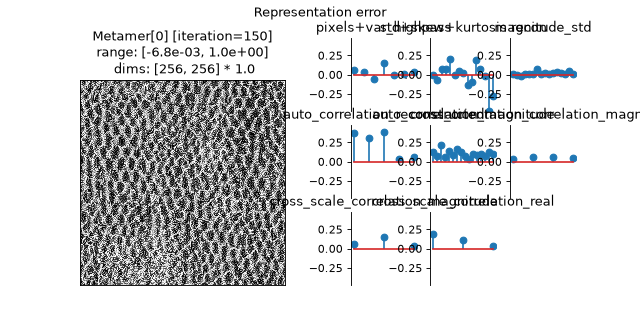
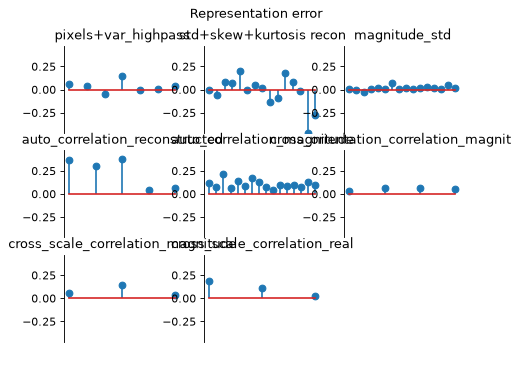
If model has its own
plot_representationmethod, this function will use it, potentially creating multiple axes (seeplot_representation):>>> img = po.data.reptile_skin() >>> model = po.models.PortillaSimoncelli(img.shape[-2:]) >>> met = po.MetamerCTF(img, model, po.loss.l2_norm) >>> met.to(torch.float64) >>> met.load(po.data.fetch_data("example_metamerCTF_ps.pt")) >>> po.plot.metamer_representation_error(met) [<Axes: ...>, ..., <Axes: ...>]

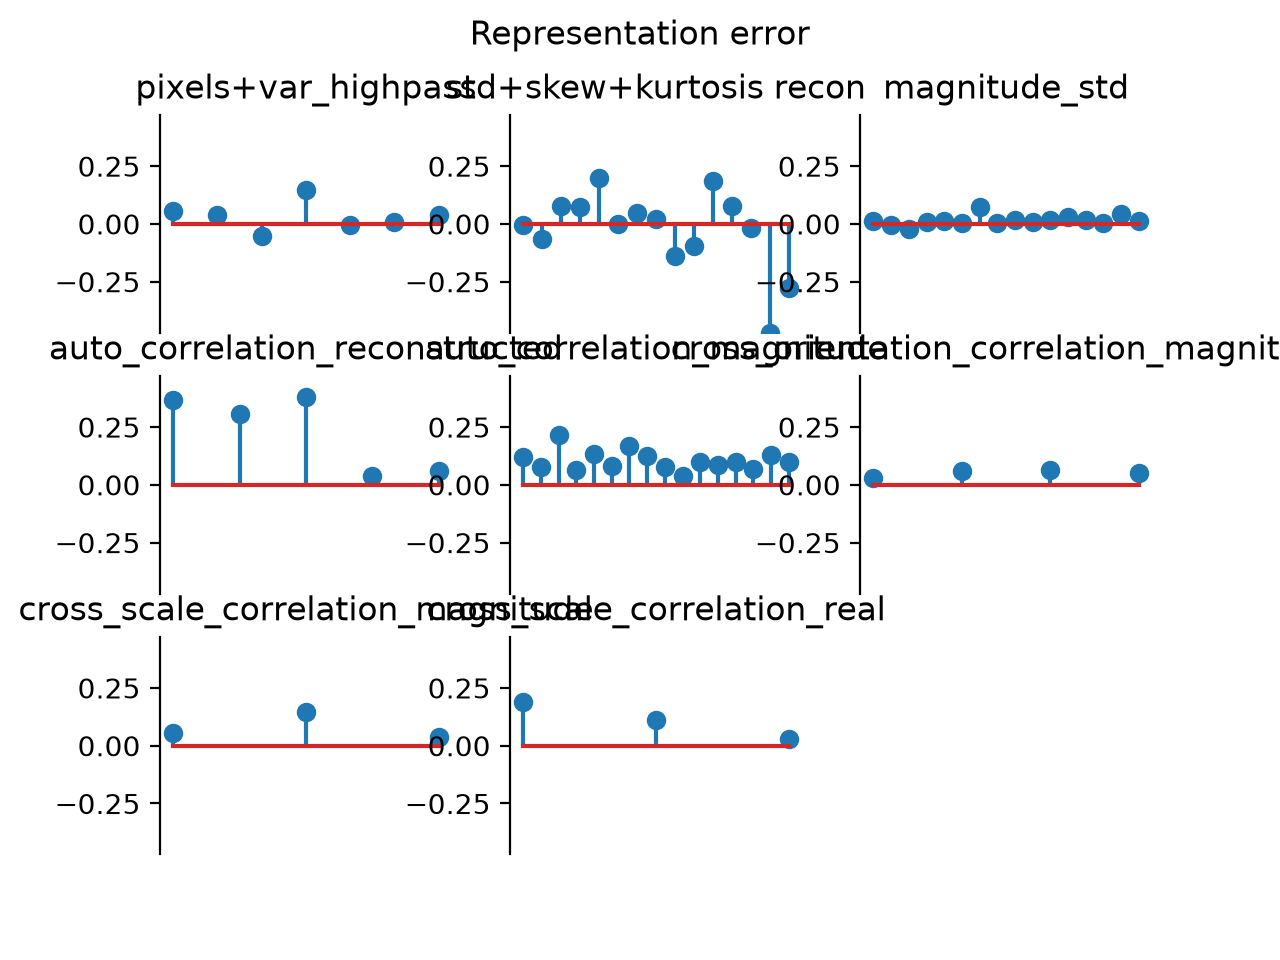
If plotting on an existing axis, this function will sub-divide that axis as needed:
>>> fig, axes = plt.subplots(1, 2, figsize=(8, 4))
>>> po.plot.synthesis_imshow(met, ax=axes[0])
<Axes: title=...Metamer[0] [iteration=150]...>
>>> po.plot.metamer_representation_error(met, ax=axes[1])
[<Axes: ...>, ..., <Axes: ...>]