plenoptic.plot.synthesis_histogram#
- plenoptic.plot.synthesis_histogram(synthesis_object, batch_idx=None, channel_idx=None, iteration=None, ylim=False, xlim='range', ax=None, alpha=0.4, **kwargs)[source]#
Plot histogram of values of synthesis objects.
Added in version 2.0: Combines previously separate loss plotting functions for
MetamerandMADCompetition, and adds support forEigendistortion.As a way to check whether there’s any values outside the preferred range.
The behavior of this function is slightly different depending on the type of
synthesis_object:MetamerandMADCompetition: compare the synthesized tensor against the target / reference image.iterationcan be specified.Eigendistortion: create histograms for eigendistortions.iterationmust beNone.
- Parameters:
synthesis_object (
Metamer|MADCompetition|Eigendistortion) – Synthesis object with the images whose values we want to plot.batch_idx (
int|None(default:None)) – Which index to take from the batch dimension. Note that forEigendistortion, this is theeigenindex. IfNone, we plot all batches as separate histograms (intended use-case is for multiple eigendistortions).channel_idx (
int|None(default:None)) – Which index to take from the channel dimension. IfNone, we use all channels (assumed use-case is RGB(A) images).iteration (
int|None(default:None)) – Which iteration to display, forMetamerandMADCompetitionobjects. IfNone, we show the most recent one. Negative values are also allowed. Ifiteration!=Noneandsynthesis_object.store_progress>1(that is, the synthesized image was not cached on every iteration), then we use the cached image from the nearest iteration. ForEigendistortion, this must beNone.ylim (
tuple[float,float] |Literal[False] (default:False)) – If tuple, the ylimit to set for this axis. IfFalse, we leave it untouched.xlim (
tuple[float,float] |Literal[False,'range'] (default:'range')) – If"range", set the xlimits to the range across plotted data. If tuple, the xlimit to set for this axis. IfFalse, we leave it untouched.ax (
Axes|None(default:None)) – Pre-existing axes for plot. IfNone, we callmatplotlib.pyplot.gca.alpha (
float(default:0.4)) – Alpha value for the histogram bars.**kwargs (
Any) – Passed tomatplotlib.pyplot.hist.
- Return type:
- Returns:
ax – Creates axes.
- Raises:
IndexError – If
iterationtakes an illegal value.ValueError – If
iterationis notNoneandsynthesis_objectis anEigendistortionobject.
- Warns:
UserWarning – If the iteration used for cached image is not the same as the argument
iteration(because e.g., you setiteration=3butsynthesis_object.store_progress=2).
See also
histogramThe plotting function used to created this plot.
synthesis_statusCreate a figure combining this with other axis-level plots to summarize synthesis status at a given iteration.
synthesis_animateCreate a video animating this and other axis-level plots changing over the course of synthesis.
Examples
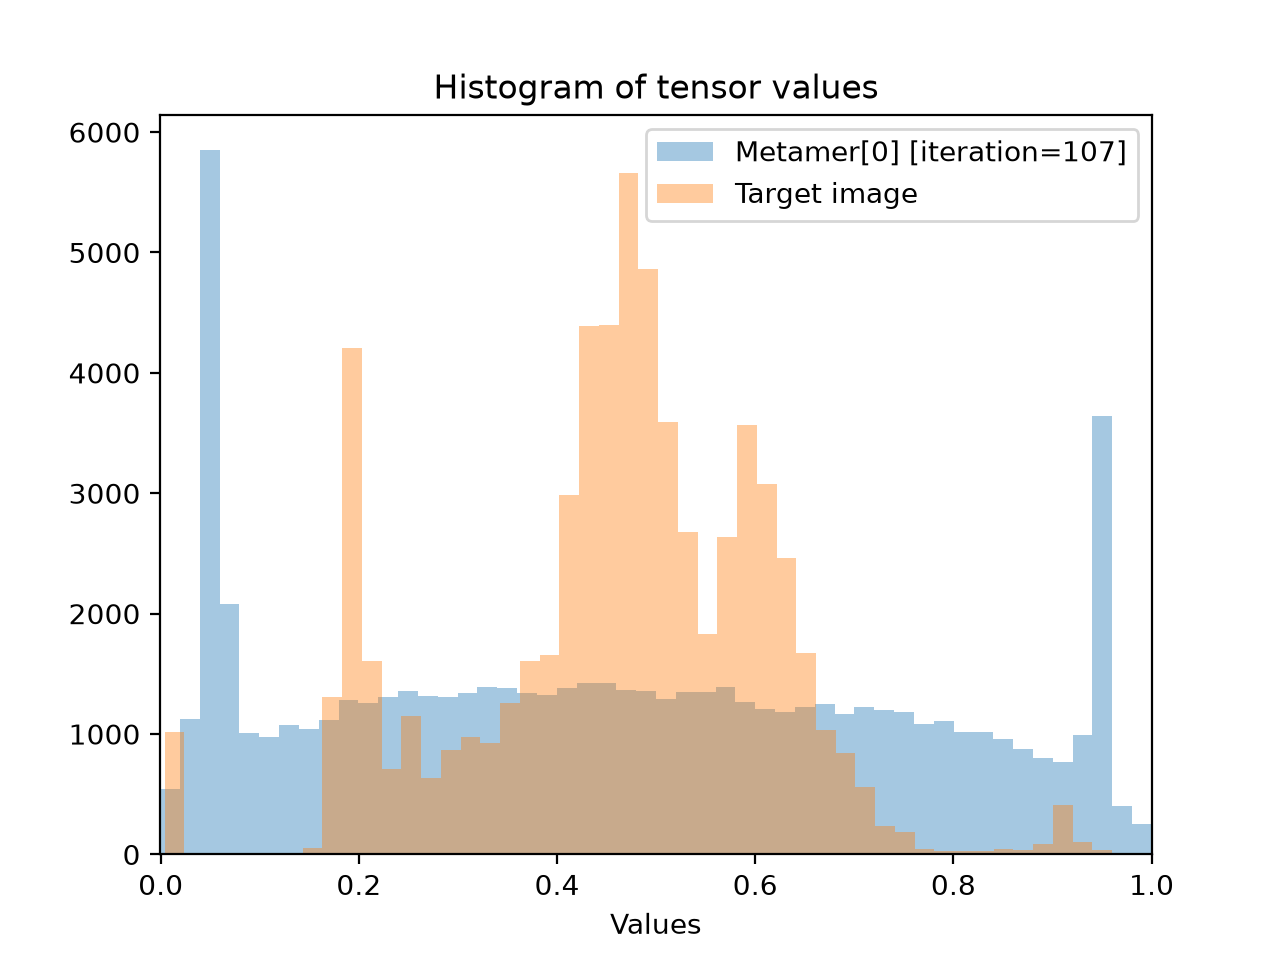
Plot histogram for
Metamerobject:>>> import plenoptic as po >>> import torch >>> img = po.data.einstein() >>> model = po.models.Gaussian(30).eval() >>> po.remove_grad(model) >>> met = po.Metamer(img, model) >>> met.to(torch.float64) >>> met.load(po.data.fetch_data("example_metamer_gaussian.pt")) >>> po.plot.synthesis_histogram(met) <Axes: ... 'Histogram of tensor values'...>

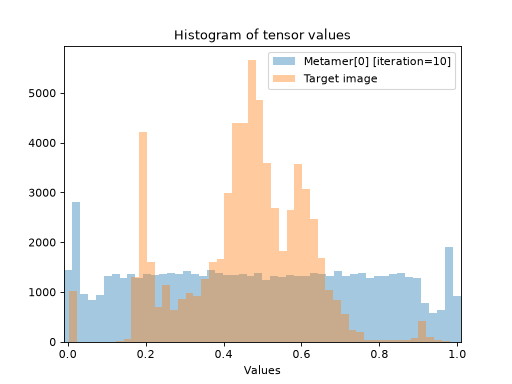
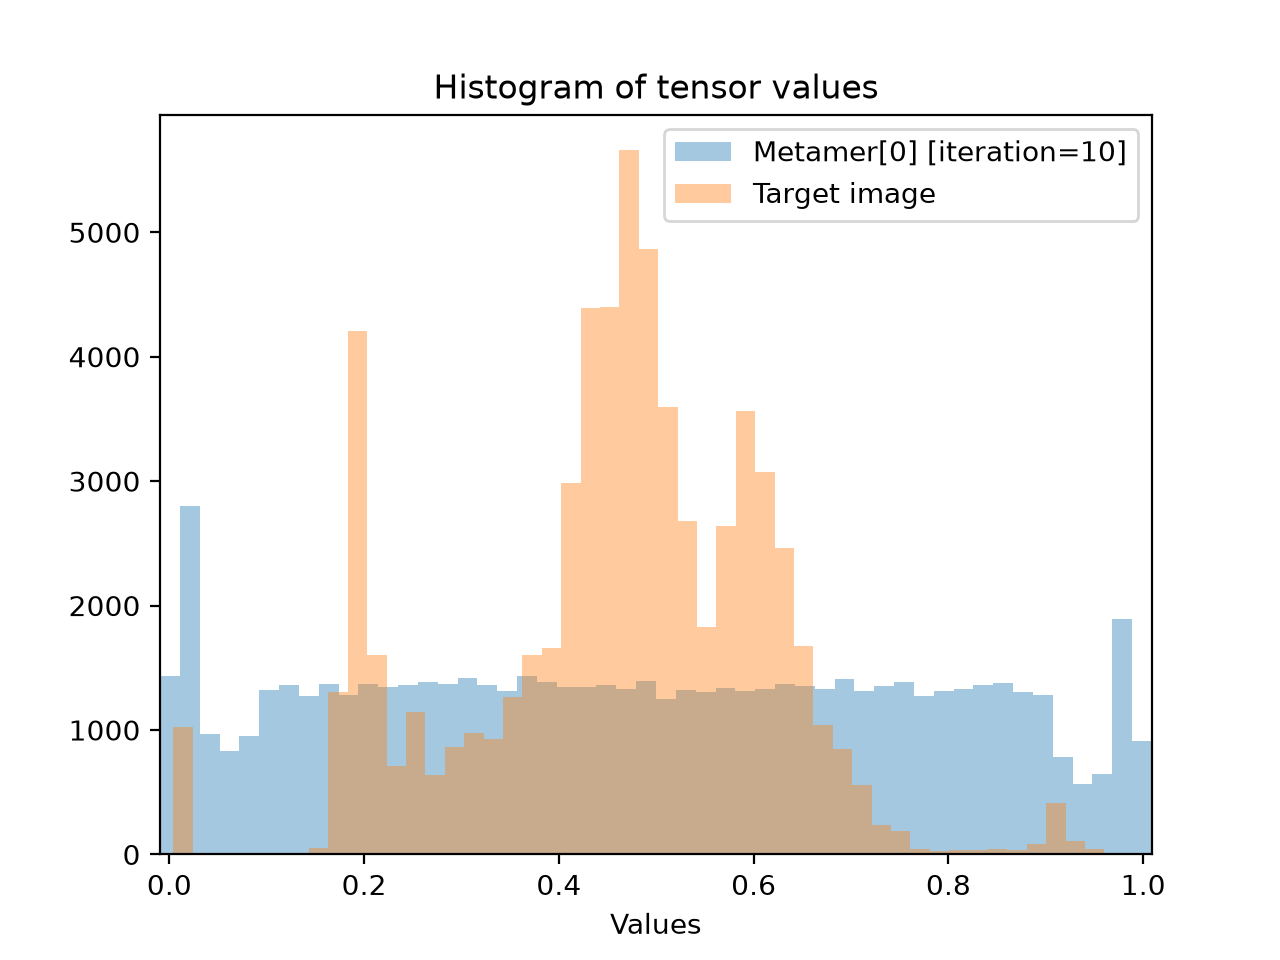
Plot pixel values from a specified iteration (requires setting
store_progresswhensynthesizewas called):>>> po.plot.synthesis_histogram(met, iteration=10) <Axes: ... 'Histogram of tensor values'...>

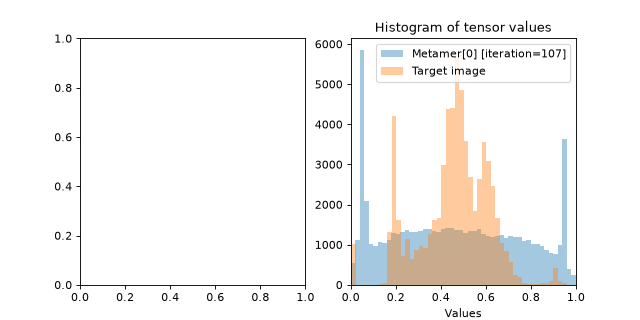
Plot on an existing axis:
>>> fig, axes = plt.subplots(1, 2, figsize=(8, 4))
>>> po.plot.synthesis_histogram(met, ax=axes[1])
<Axes: ... 'Histogram of tensor values'...>
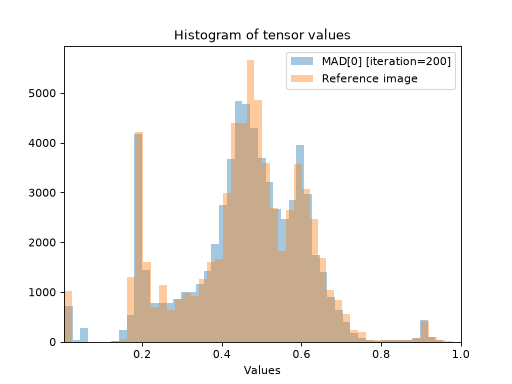
Plot histogram for
MADCompetitionobject:>>> img = po.data.einstein().to(torch.float64) >>> def ds_ssim(x, y): ... return 1 - po.metric.ssim(x, y, weighted=True, pad="reflect") >>> mad = po.MADCompetition(img, ds_ssim, po.metric.mse, "max", 1e6) >>> mad.load(po.data.fetch_data("example_mad.pt")) >>> po.plot.synthesis_histogram(mad) <Axes: ... 'Histogram of tensor values'...>

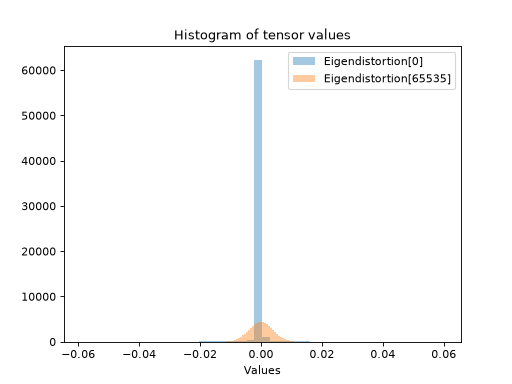
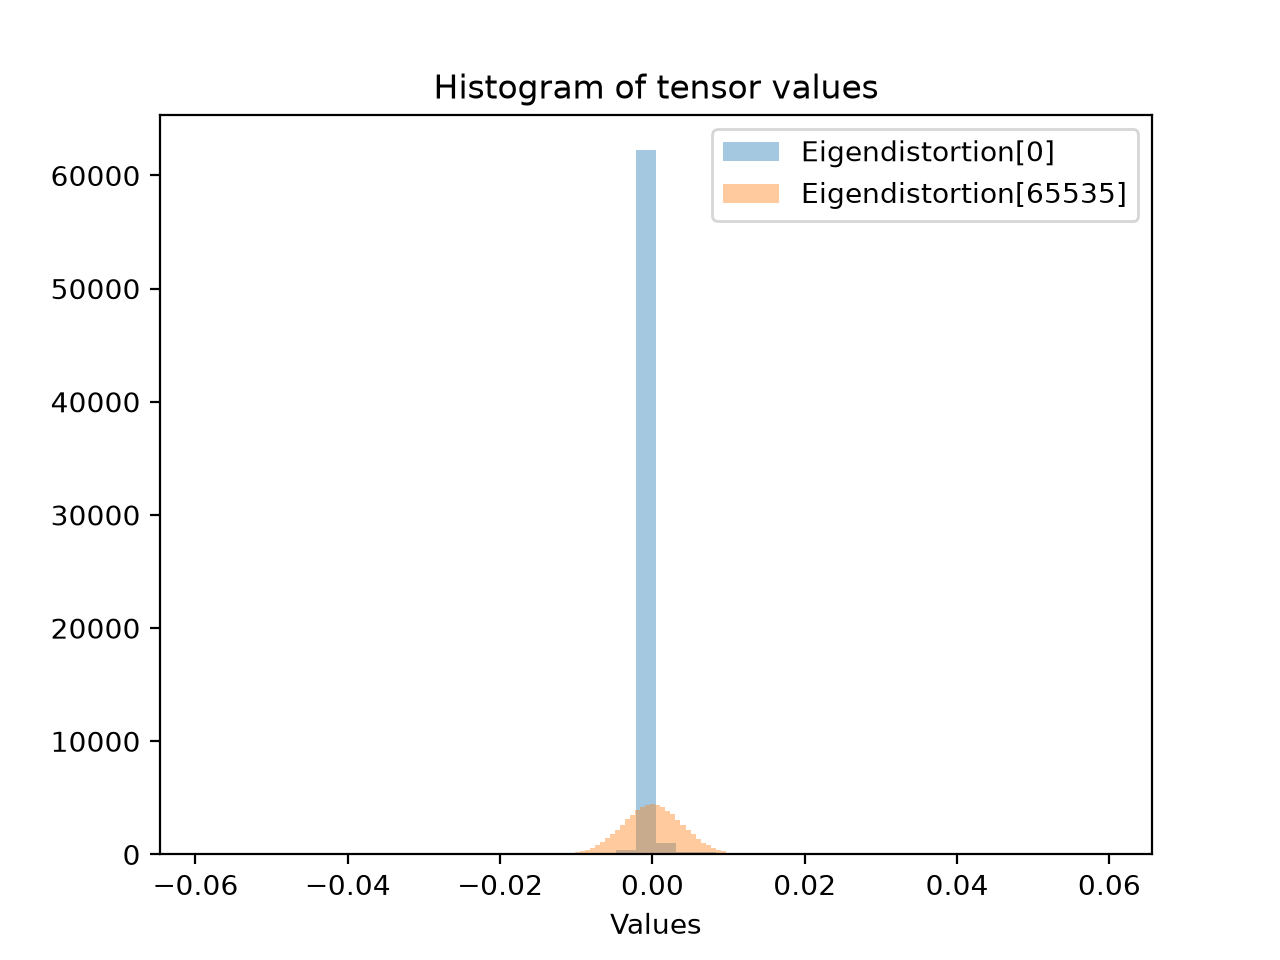
Plot histogram for
Eigendistortionobject. Notice how here we plot just the values from the synthesized eigendistortions, not the base image.>>> img = po.data.einstein().to(torch.float64) >>> lg = po.models.LuminanceGainControl( ... (31, 31), pad_mode="circular", pretrained=True, cache_filt=True ... ).eval() >>> lg = lg.to(torch.float64) >>> po.remove_grad(lg) >>> eig = po.Eigendistortion(img, lg) >>> eig.load( ... po.data.fetch_data("example_eigendistortion.pt"), ... map_location="cpu", ... ) >>> po.plot.synthesis_histogram(eig) <Axes: ... 'Histogram of tensor values'...>
