plenoptic.plot.synthesis_imshow#
- plenoptic.plot.synthesis_imshow(synthesis_object, batch_idx=0, channel_idx=None, distortion_scale=5.0, process_image=None, zoom=None, iteration=None, ax=None, title=None, **kwargs)[source]#
Display image of synthesis object.
Added in version 2.0: Combines previously separate loss plotting functions for
Metamer,MADCompetition, andEigendistortion.We use
imshowto display the synthesized image and attempt to automatically find the most reasonable zoom value. You can override this value using the zoom arg, but remember thatimshowis opinionated about the size of the resulting image and will throw an Exception if the axis created is not big enough for the selected zoom.The behavior of this function is slightly different depending on the type of
synthesis_object:MetamerandMADCompetition: process and display the synthesized image.iterationcan be specified,distortion_scalemust be unchanged.Eigendistortion: process and displayimage + (distortion_scale * eigendistortion).iterationmust beNone,distortion_scalecan be set.
- Parameters:
synthesis_object (
Metamer|MADCompetition|Eigendistortion) – Synthesis object with the images we wish to display.batch_idx (
int(default:0)) – Which index to take from the batch dimension. Note that forEigendistortion, this is theeigenindex.channel_idx (
int|None(default:None)) – Which index to take from the channel dimension. IfNone, plot all channels; if image has more than 1 channel, will attempt to plot as RGB(A) image.distortion_scale (
float(default:5.0)) – Amount by which to scale eigendistortion forimage + (distortion_scale * eigendistortion)for display. Ifsynthesis_objectis notEigendistortion, must not be set.process_image (
Callable[[Tensor],Tensor] |None(default:None)) – A function to process the plotted image. E.g., multiplying by the stdev ImageNet then adding the mean of ImageNet to undo image preprocessing or clamping between 0 and 1. IfNone, then no processing is performed.zoom (
float|None(default:None)) – How much to zoom in / enlarge the synthesized image, the ratio of display pixels to image pixels. IfNone, we attempt to find the best value ourselves.iteration (
int|None(default:None)) – Which iteration to display, forMetamerandMADCompetitionobjects. IfNone, we show the most recent one. Negative values are also allowed. Ifiteration!=Noneandsynthesis_object.store_progress>1(that is, the synthesized image was not cached on every iteration), then we use the cached image from the nearest iteration.ax (
Axes|None(default:None)) – Pre-existing axes for plot. IfNone, we callmatplotlib.pyplot.gca.title (
str|None(default:None)) – Title to add to axis. IfNone, we pick appropriate title based on the type ofsynthesis_object.
- Return type:
- Returns:
ax – The matplotlib axes containing the plot.
- Raises:
ValueError – If
batch_idxis not an int.IndexError – If
iterationtakes an illegal value.
- Warns:
UserWarning – If the iteration used for cached image is not the same as the argument
iteration(because e.g., you setiteration=3butsynthesis_object.store_progress=2).
See also
imshowFunction used by this one to visualize the metamer image.
synthesis_statusCreate a figure combining this with other axis-level plots to summarize synthesis status at a given iteration.
synthesis_animateCreate a video animating this and other axis-level plots changing over the course of synthesis.
mad_imshow_allDisplay all MAD Competition images from a complete set of four
MADCompetitioninstances.eigendistortion_imshow_allDisplay base image, eigendistortions alone, and eigendistortions added to image together in a single figure.
Examples
Plot for
Metamerobject:>>> import plenoptic as po >>> import matplotlib.pyplot as plt >>> import torch >>> img = po.data.einstein() >>> model = po.models.Gaussian(30).eval() >>> po.remove_grad(model) >>> met = po.Metamer(img, model) >>> met.to(torch.float64) >>> met.load(po.data.fetch_data("example_metamer_gaussian.pt")) >>> po.plot.synthesis_imshow(met) <Axes: title=...Metamer[0] [iteration=107]...>

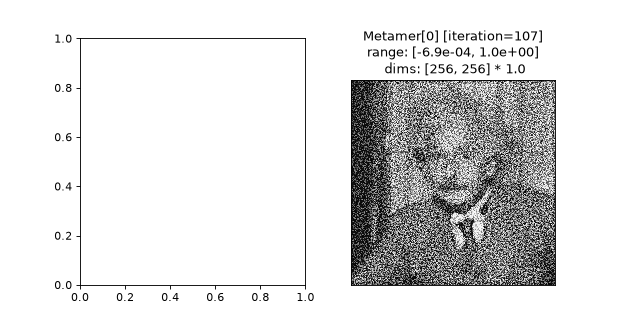
If a matplotlib figure exists, this function will use it (using
matplotlib.pyplot.gca):>>> fig, axes = plt.subplots(1, 2) >>> po.plot.synthesis_imshow(met) <Axes: title=...Metamer[0] [iteration=107]...>

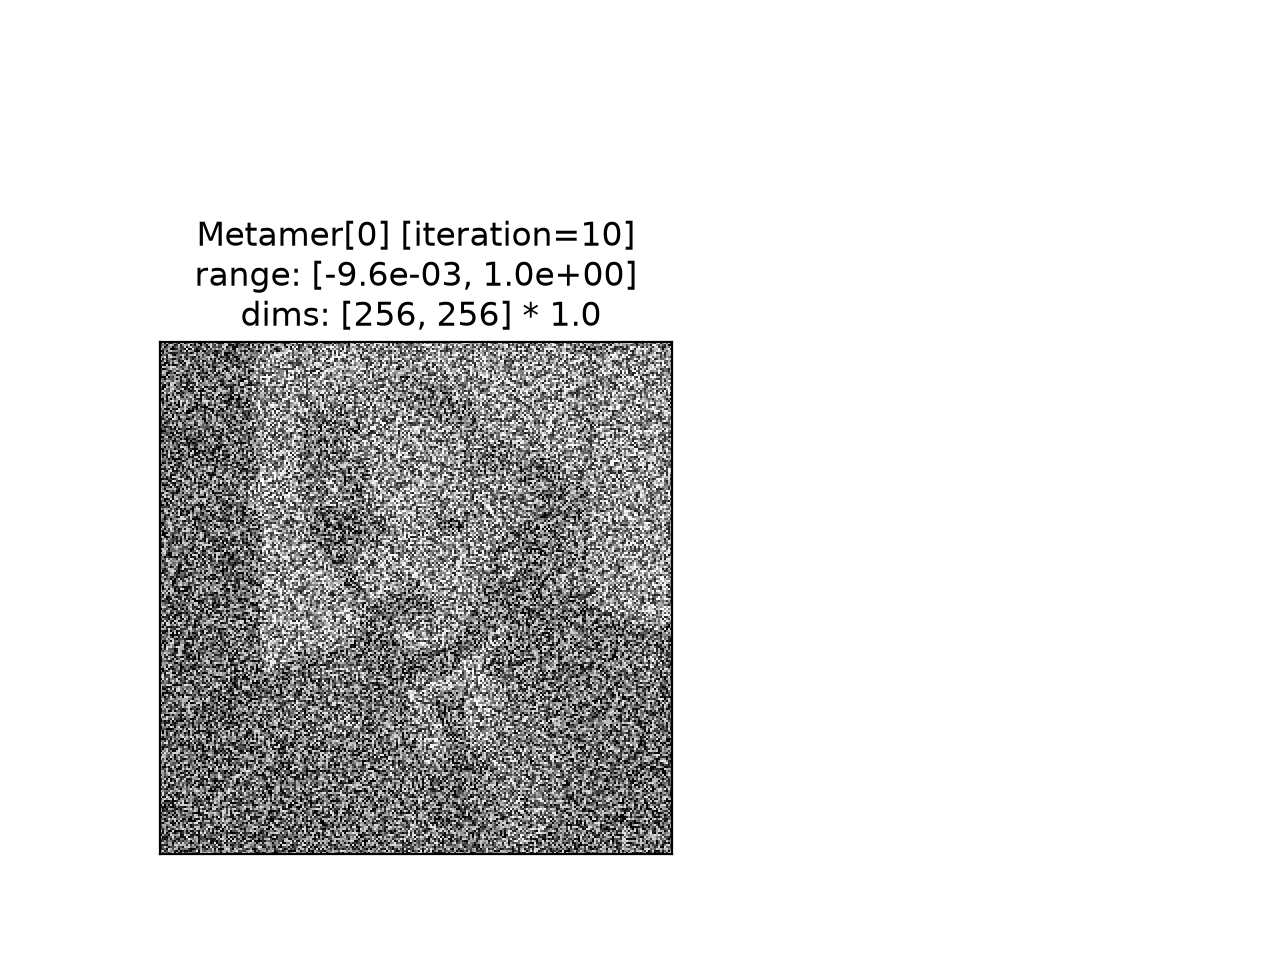
Display metamer from a specified iteration (requires setting
store_progresswhensynthesizewas called):>>> po.plot.synthesis_imshow(met, iteration=10) <Axes: title=...Metamer[0] [iteration=10]...>

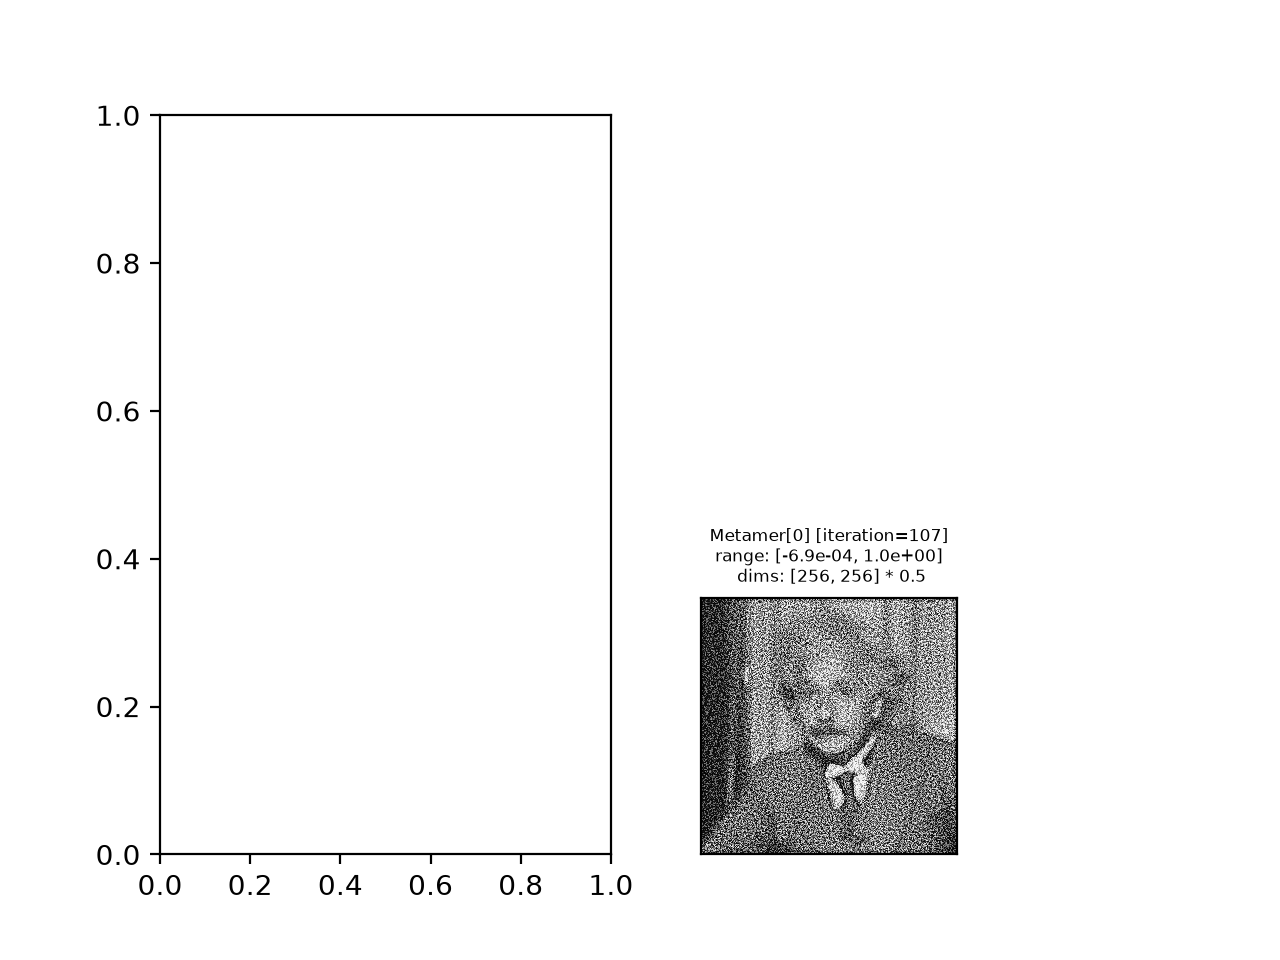
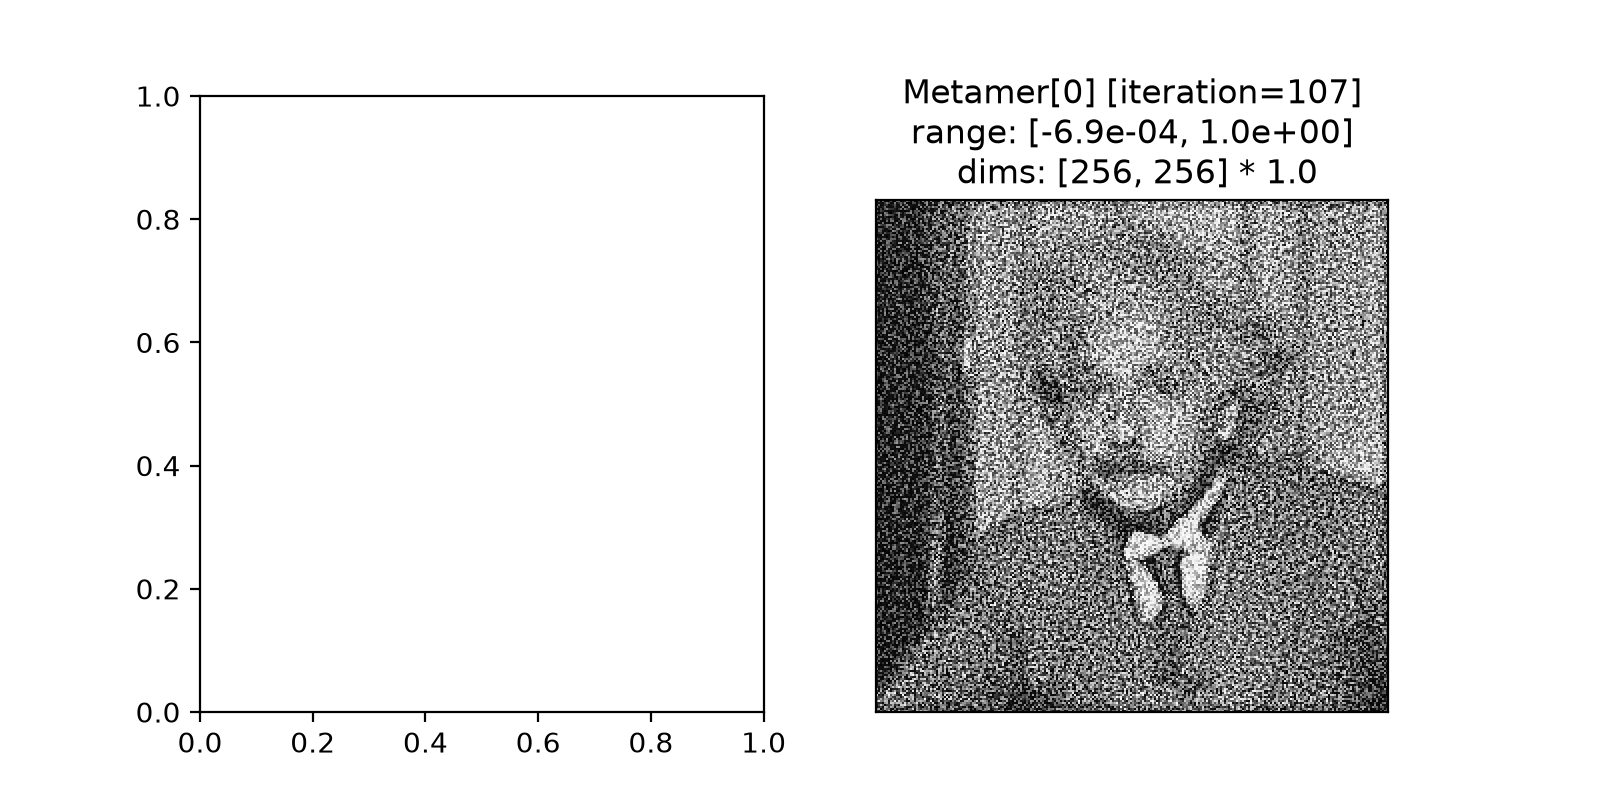
Explicitly define the axis to use:
>>> fig, axes = plt.subplots(1, 2, figsize=(8, 4))
>>> po.plot.synthesis_imshow(met, ax=axes[1])
<Axes: title=...Metamer[0] [iteration=107]...>
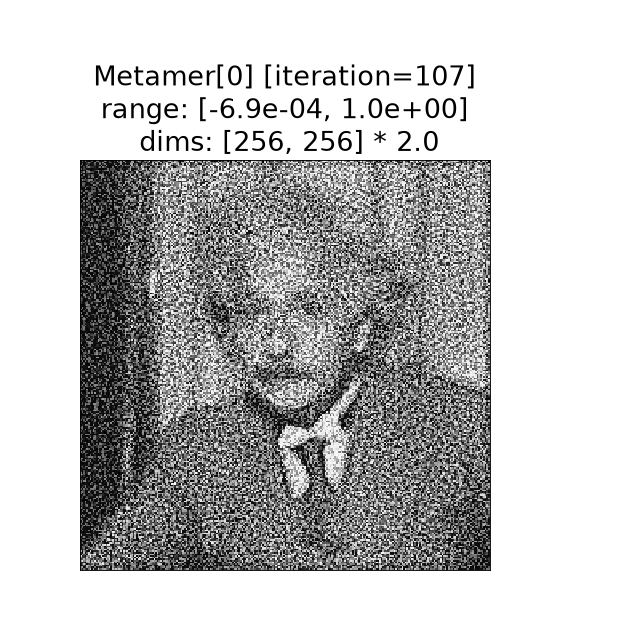
When plotting on an existing axis, if
zoom=None, this function will determine the best zoom level for the axis size.>>> fig, axes = plt.subplots(1, 1, figsize=(8, 8)) >>> po.plot.synthesis_imshow(met, ax=axes) <Axes: title=...Metamer[0] [iteration=107]...dims: [256, 256] * 2.0'}>
Plot for
MADCompetitionobject:>>> img = po.data.einstein().to(torch.float64) >>> def ds_ssim(x, y): ... return 1 - po.metric.ssim(x, y, weighted=True, pad="reflect") >>> mad = po.MADCompetition(img, ds_ssim, po.metric.mse, "max", 1e6) >>> mad.load(po.data.fetch_data("example_mad.pt")) >>> po.plot.synthesis_imshow(mad) <Axes: title=...MAD[0] [iteration=200]...>

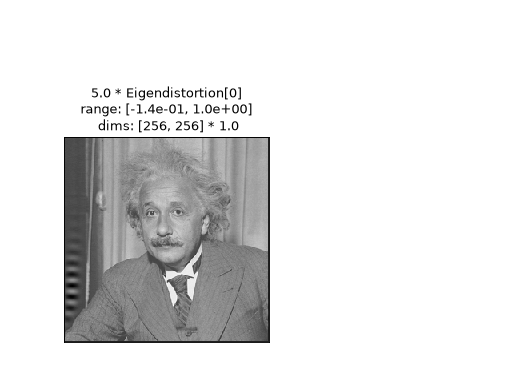
Plot for
Eigendistortionobject. Note here that we plot the distortion multiplied bydistortion_scaleand added to the target image.>>> img = po.data.einstein().to(torch.float64) >>> lg = po.models.LuminanceGainControl( ... (31, 31), pad_mode="circular", pretrained=True, cache_filt=True ... ).eval() >>> lg = lg.to(torch.float64) >>> po.remove_grad(lg) >>> eig = po.Eigendistortion(img, lg) >>> eig.load( ... po.data.fetch_data("example_eigendistortion.pt"), ... map_location="cpu", ... ) >>> po.plot.synthesis_imshow(eig) <Axes: title=...5.0 * Eigendistortion[0]...range: [-1.4e-01, 1.0e+00]...>

Use the
process_imageargument to apply a preprocessing function to the image before plotting it:>>> po.plot.synthesis_imshow(eig, process_image=lambda x: x.clip(0, 1)) <Axes: title=...5.0 * Eigendistortion[0]...range: [0.0e+00, 1.0e+00]...>

See
eigendistortion_imshow_allfor how to setprocess_imageto undo ImageNet normalization.