plenoptic.plot.synthesis_status#
- plenoptic.plot.synthesis_status(synthesis_object, batch_idx=0, channel_idx=None, iteration=None, included_plots=None, fig=None, axes_idx={}, figsize=None, width_ratios={}, **kwargs)[source]#
Make a plot showing synthesis status.
Added in version 2.0: Combines previously separate loss plotting functions for
Metamer,MADCompetition, and adds support forEigendistortion.We create several subplots to analyze this. The plots to include are specified by including their name in the
included_plotslist. All plots can be created separately using the method with the individual plot name (see See Also section below).This function’s behavior when
included_plots is None, and allowed values for that variable, depends upon the type ofsynthesis_object:Metamer:synthesis_imshow,synthesis_loss,metamer_representation_error. Additional allowed values:synthesis_histogram.MADCompetition:synthesis_imshow,synthesis_loss. Additional allowed values:synthesis_histogram.
- Parameters:
synthesis_object (
Metamer|MADCompetition|Eigendistortion) – Synthesis object with status to plot.batch_idx (
int(default:0)) – Which index to take from the batch dimension.channel_idx (
int|None(default:None)) – Which index to take from the channel dimension. IfNone, plot all channels.iteration (
int|None(default:None)) – Which iteration to display, forMetamerandMADCompetitionobjects. IfNone, we show the most recent one. Negative values are also allowed. Ifiteration!=Noneandsynthesis_object.store_progress>1(that is, the synthesized image was not cached on every iteration), then we use the cached image from the nearest iteration.included_plots (
list[str] |None(default:None)) – Which plots to include. See above for behavior ifNone, otherwise must be a list of strings whose values are names of plotting functions that can acceptsynthesis_object, see above for list.fig (
Figure|None(default:None)) – IfNone, we create a new figure. Otherwise we assume this is a figure that has the appropriate size and number of subplots.axes_idx (
dict[str,int|list[int]] (default:{})) – Dictionary specifying which axes contains which type of plot, allows for more fine-grained control of the resulting figure. Keys must be strings matching the names of the included plots, see above for possible values, or"misc". All axes in"misc"will be ignored by this function. If you tell this function to create a plot that doesn’t have a corresponding key, we find the lowest int that is not already in the dict, so if you have axes that you want unchanged, place their idx in'misc'.figsize (
tuple[float,float] |None(default:None)) – The size of the figure to create. It may take a little bit of playing around to find a reasonable value. IfNone, we attempt to make our best guess, aiming to have each axis be of size(5, 5).width_ratios (
dict[str,float] (default:{})) – Ifwidth_ratiosis an empty dictionary, plot widths will depend onsynthesis_objectclass: forMADCompetition,synthesis_losswill have double the width of the rest; for other classes, all will be the same width. To change that, specify their relative widths; keys should be strings (possible values same asincluded_plots) and values should be floats specifying their relative width.**kwargs (
dict[str,Any]) – Additional keyword arguments to pass to plotting functions. Keys must be the of the form{plot_func}_kwargs, where{plot_func}name of the plotting function. See Examples for examples. Will raise a ValueError if there are additional kwargs.
- Return type:
- Returns:
fig – The figure containing this plot.
- Raises:
ValueError – If the
iteration is not Noneand the givensynthesis_objectobject isEigendistortionor synthesis was run withstore_progress=False.ValueError – If any of
width_ratios,included_plots, oraxes_idxreference an plot that is incompatible withsynthesis_object. See list at top of docstring for compatible plots for each class.ValueError – If
kwargscontains additional keys.
- Warns:
UserWarning – If the iteration used for cached image is not the same as the argument
iteration(because e.g., you setiteration=3butsynthesis_object.store_progress=2).
See also
synthesis_imshowOne of this function’s axis-level component functions: display synthesized image at a given synthesis iteration.
synthesis_lossOne of this function’s axis-level component functions: plot synthesis loss over iterations.
metamer_representation_errorOne of this function’s axis-level component functions: plot error in model representation at a given metamer synthesis iteration.
synthesis_histogramOne of this function’s axis-level component functions: plot histogram of values from synthesized object.
synthesis_animateCreate a video that animates this figure over synthesis iteration.
Examples
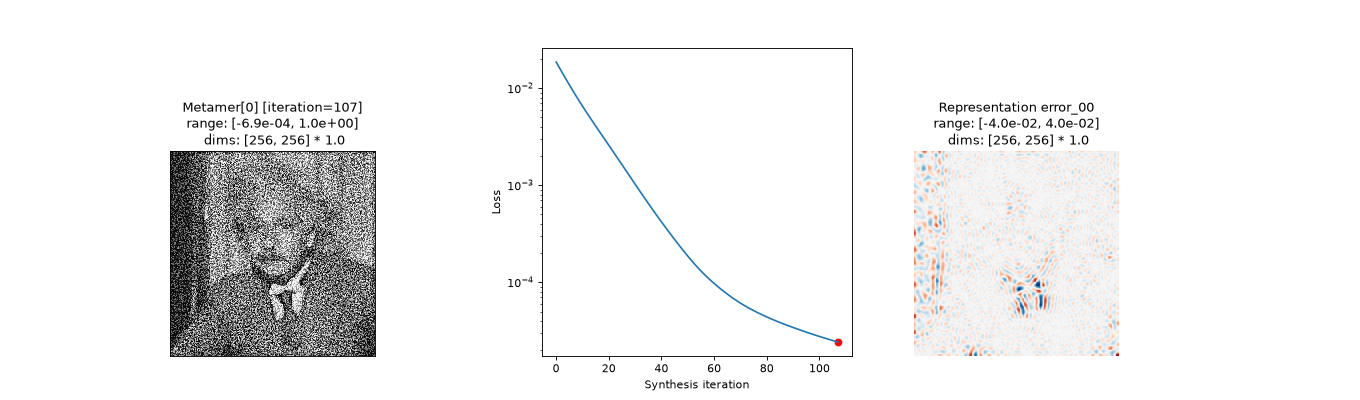
Plot for a
Metamerobject:>>> import plenoptic as po >>> import torch >>> img = po.data.einstein() >>> model = po.models.Gaussian(30).eval() >>> po.remove_grad(model) >>> met = po.Metamer(img, model) >>> met.to(torch.float64) >>> met.load(po.data.fetch_data("example_metamer_gaussian.pt")) >>> po.plot.synthesis_status(met) <Figure size ...>
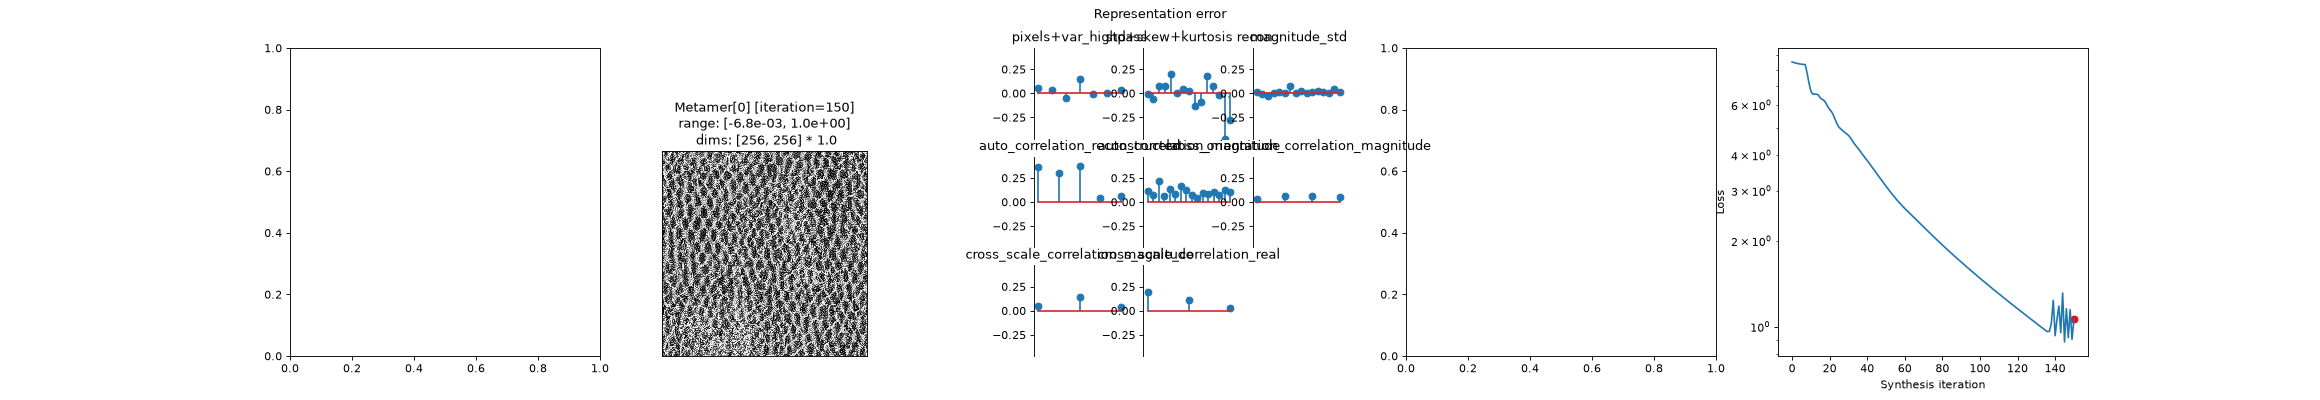
If model has its own
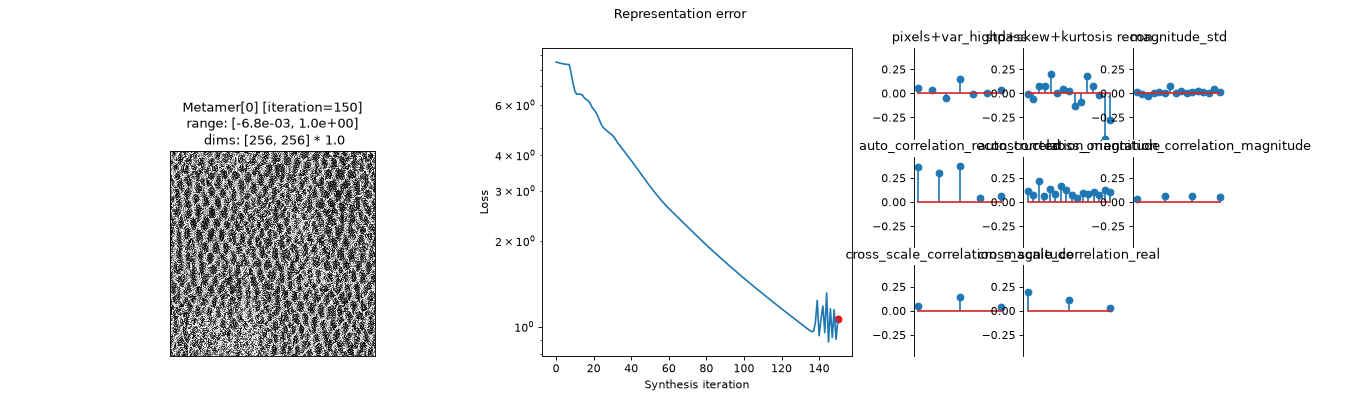
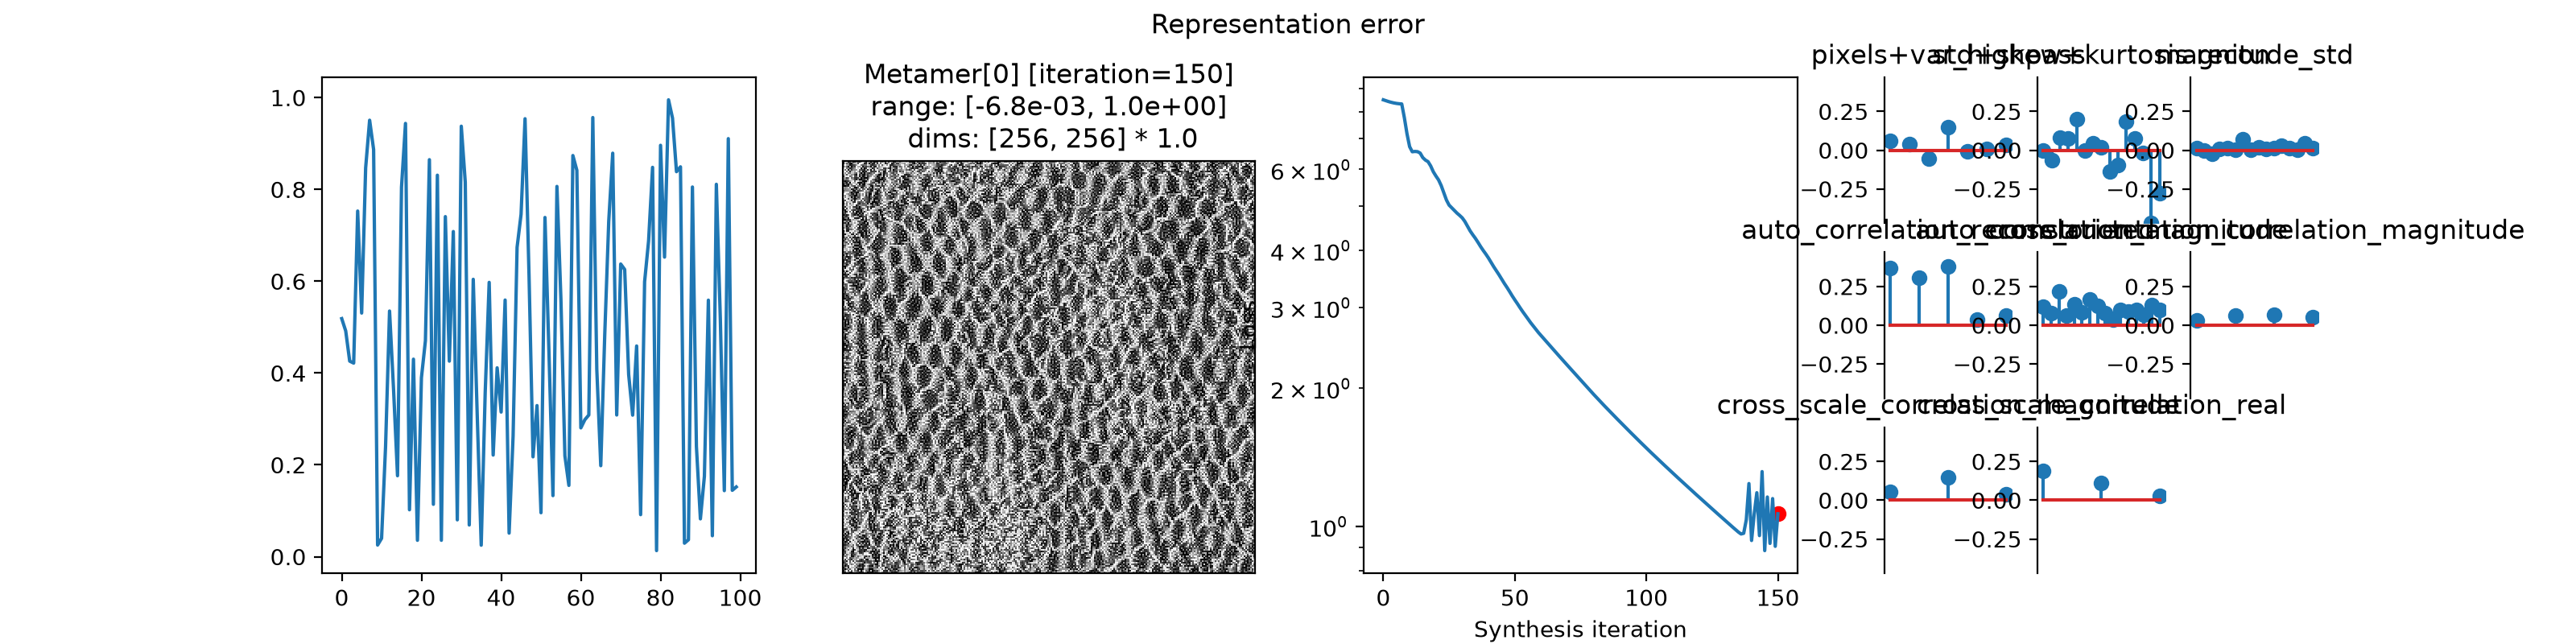
plot_representationmethod, this function will use it for plotting the representation error (seeplot_representation):>>> img = po.data.reptile_skin() >>> model = po.models.PortillaSimoncelli(img.shape[-2:]) >>> met = po.MetamerCTF(img, model, po.loss.l2_norm) >>> met.to(torch.float64) >>> met.load(po.data.fetch_data("example_metamerCTF_ps.pt")) >>> po.plot.synthesis_status(met) <Figure size ...>

Plot a different iteration of synthesis:
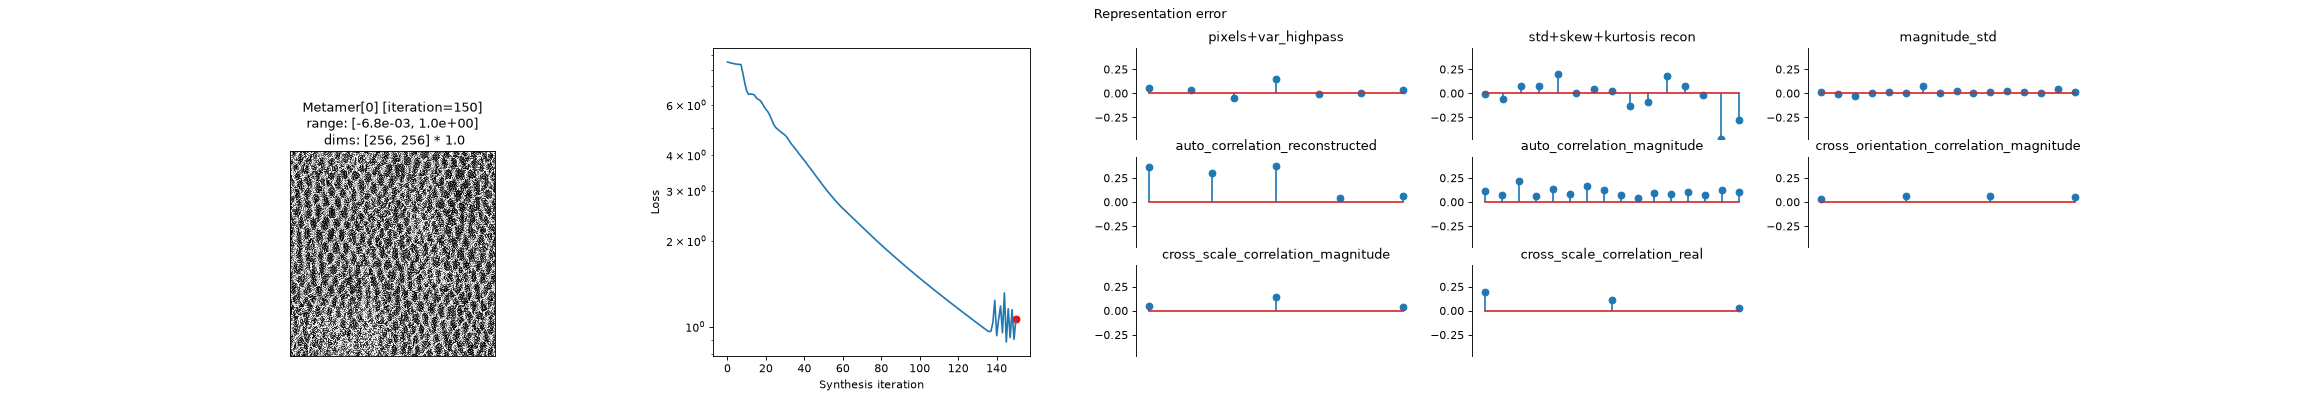
>>> po.plot.synthesis_status(met, iteration=10)
<Figure size ...>

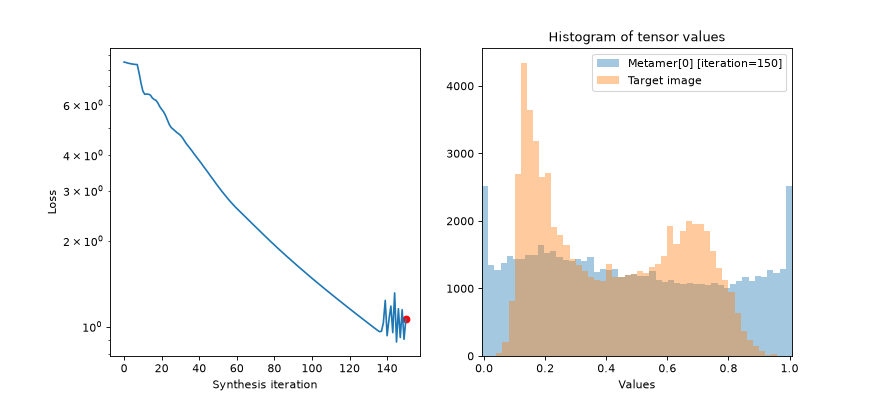
Change the included plots:
>>> included_plots = ["synthesis_loss", "synthesis_histogram"]
>>> po.plot.synthesis_status(met, included_plots=included_plots)
<Figure size ...>
Adjust width of included plots:
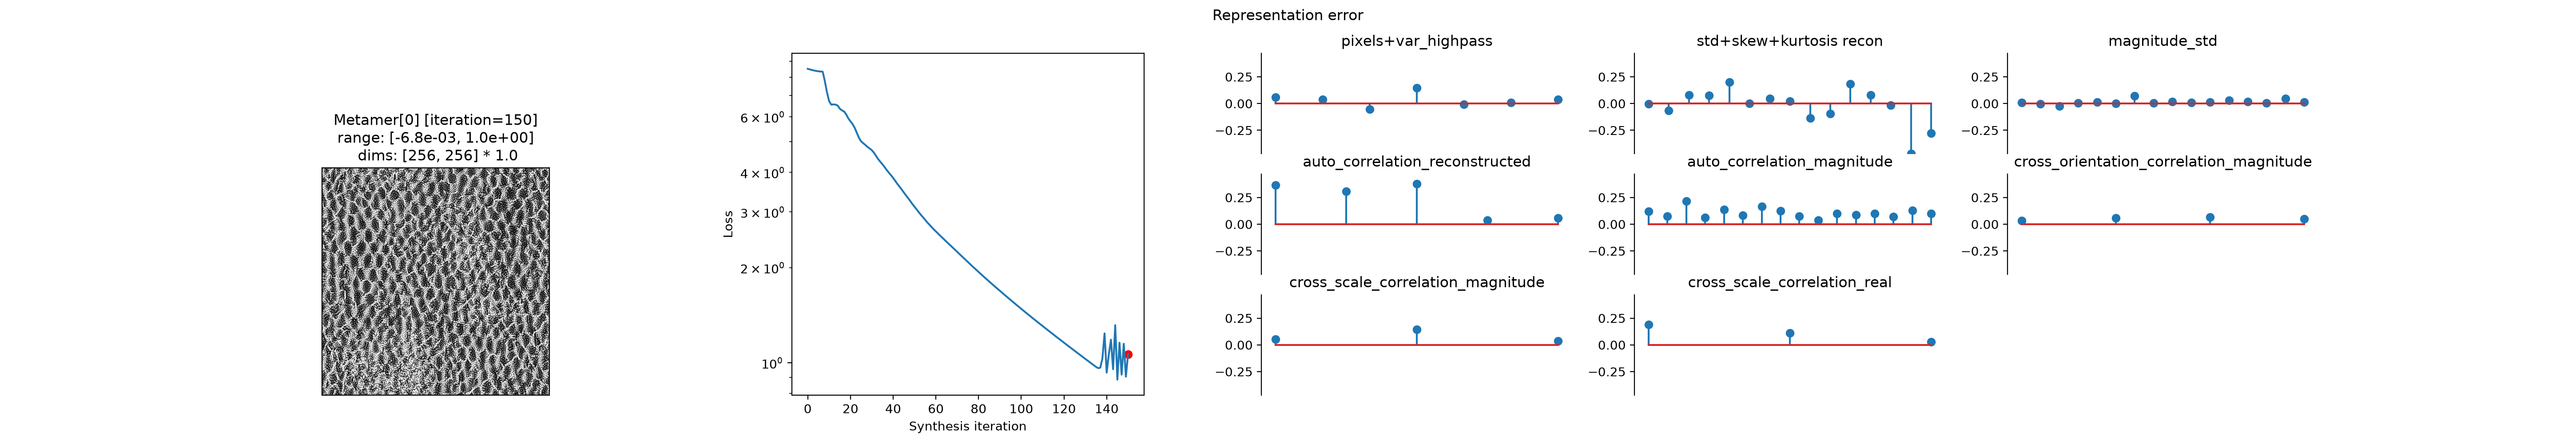
>>> width_ratios = {"metamer_representation_error": 3}
>>> po.plot.synthesis_status(met, width_ratios=width_ratios)
<Figure size ...>

Change the arrangement of the plots, creating some empty axes:
>>> axes_idx = {"misc": [0, 3], "synthesis_loss": 4}
>>> po.plot.synthesis_status(met, axes_idx=axes_idx)
<Figure size ...>
Plot on an existing figure, with already existing plots:
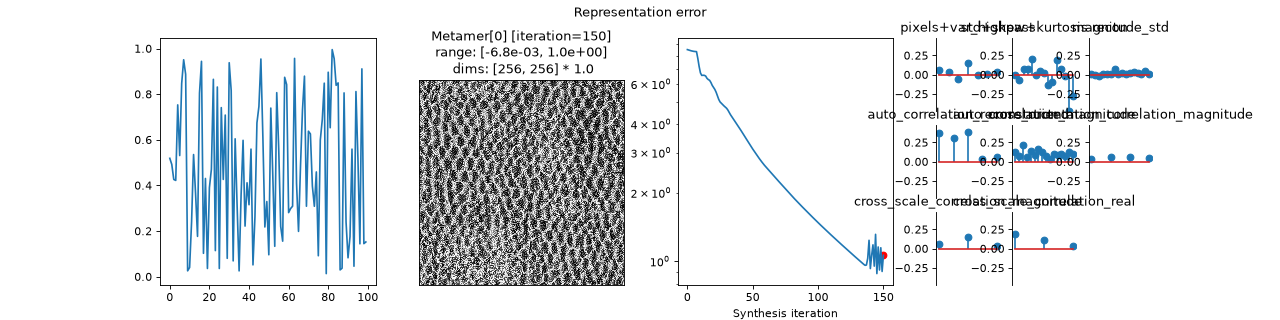
>>> fig, axes = plt.subplots(1, 4, figsize=(16, 4))
>>> axes[0].plot(torch.rand(100))
[<matplotlib.lines.Line2D ...>]
>>> # specify misc: 0 so we don't plot on top of this axis.
>>> axes_idx = {"misc": 0}
>>> po.plot.synthesis_status(met, fig=fig, axes_idx=axes_idx)
<Figure size ...>

Note that if you pass a figure, it must already have axes created:
>>> fig = plt.figure()
>>> po.plot.synthesis_status(met, fig=fig)
Traceback (most recent call last):
IndexError: list index out of range
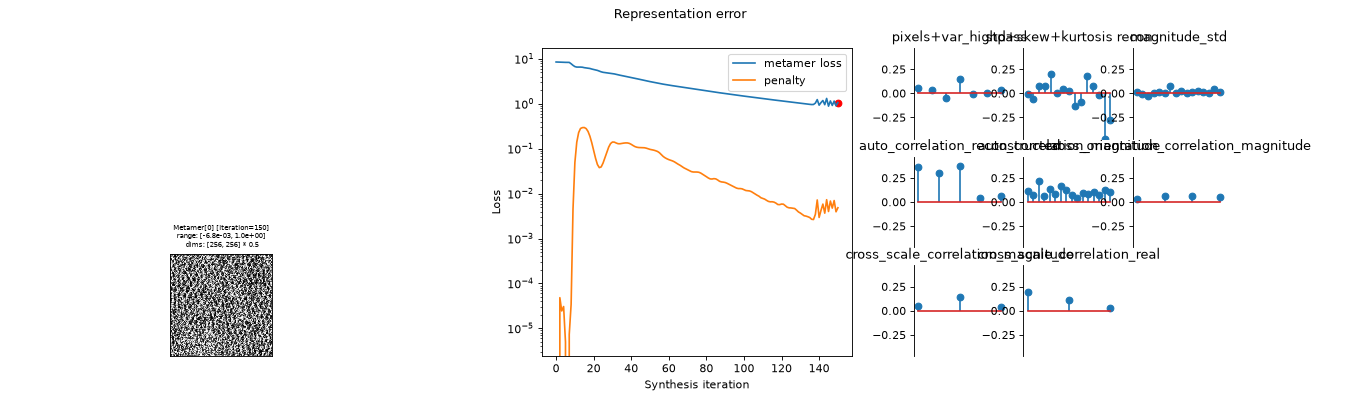
Specify additional keyword arguments to one of the underlying plots:
>>> po.plot.synthesis_status(
...     met,
...     synthesis_loss_kwargs={"plot_penalties": True},
...     synthesis_imshow_kwargs={"zoom": 0.5},
... )
<Figure size ...>
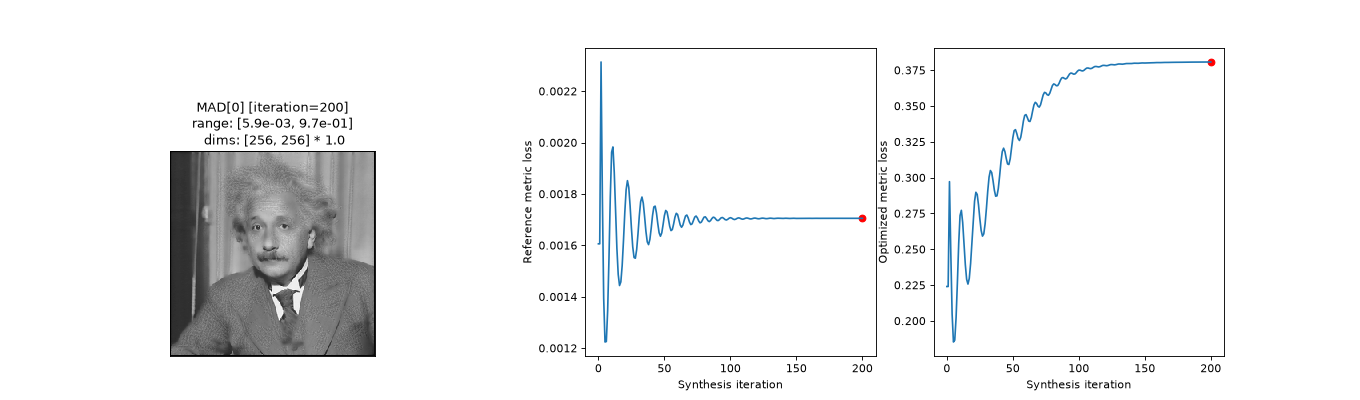
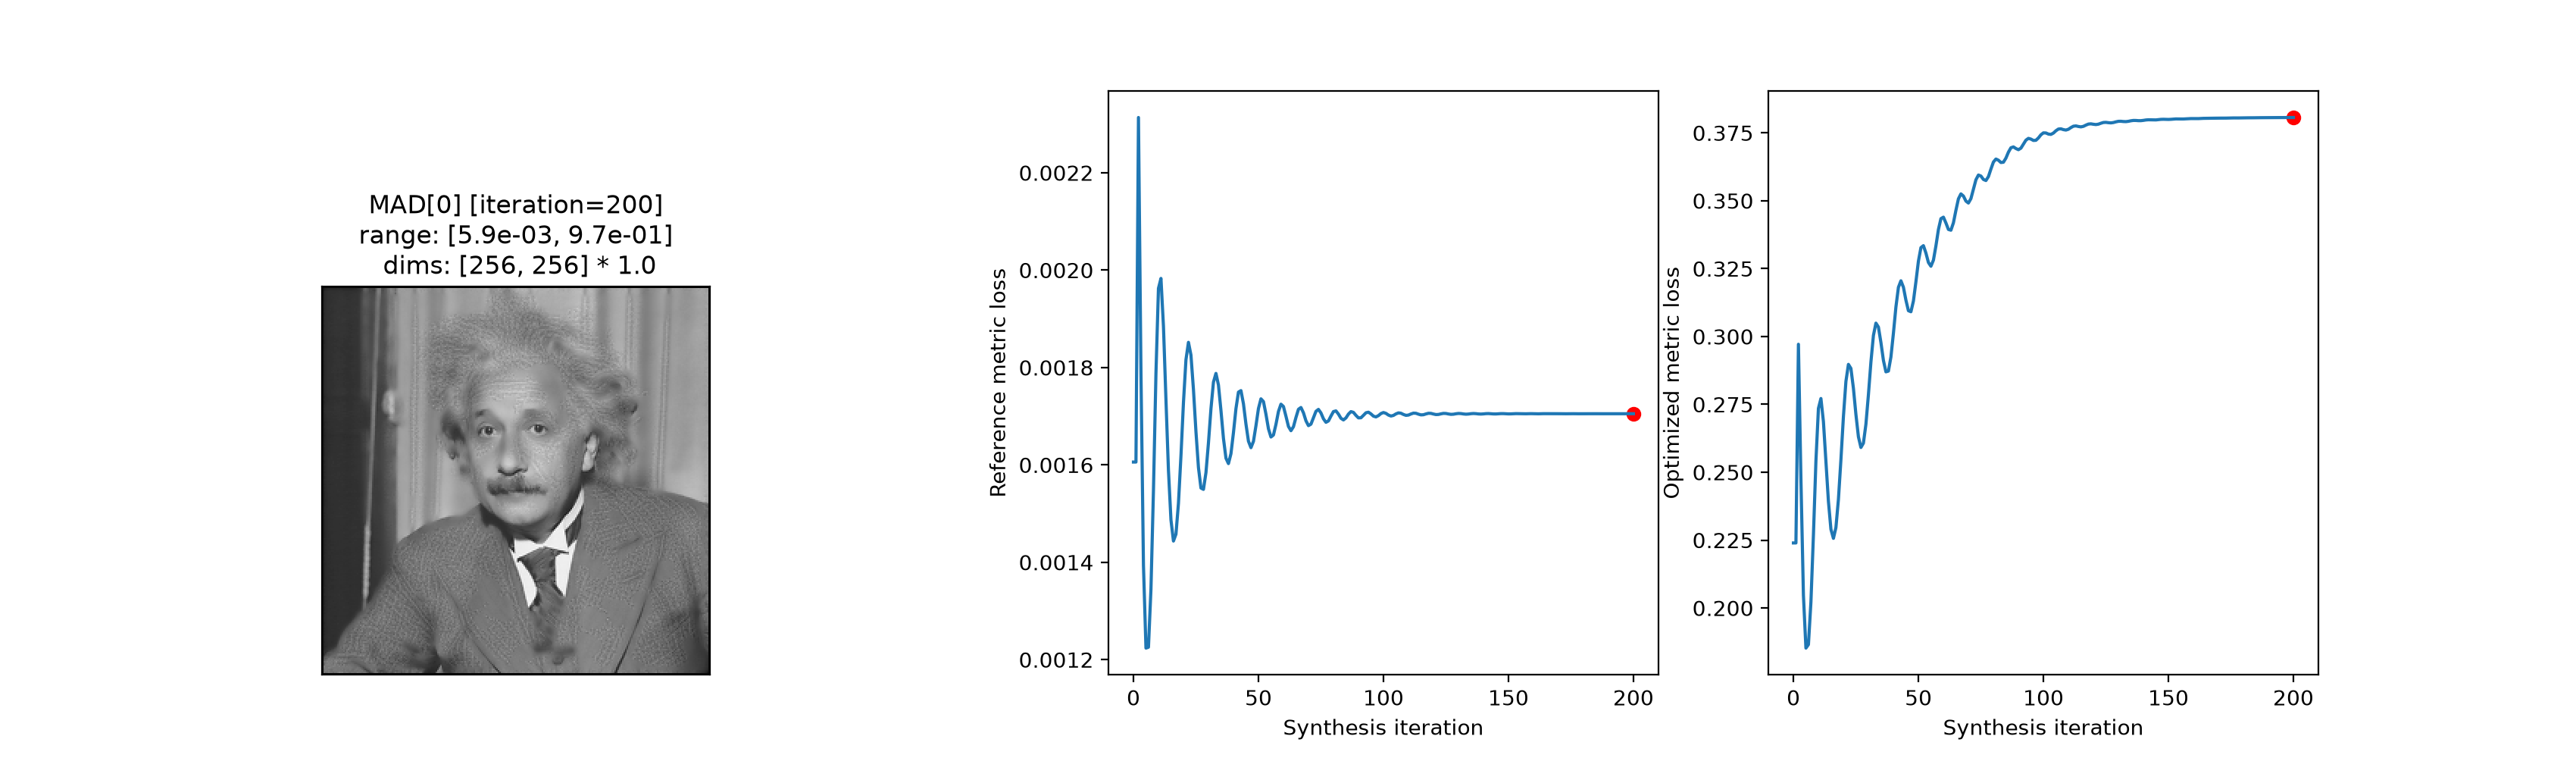
Plot for
MADCompetitionobject. Note the plots are different:>>> img = po.data.einstein().to(torch.float64) >>> def ds_ssim(x, y): ... return 1 - po.metric.ssim(x, y, weighted=True, pad="reflect") >>> mad = po.MADCompetition(img, ds_ssim, po.metric.mse, "max", 1e6) >>> mad.load(po.data.fetch_data("example_mad.pt")) >>> po.plot.synthesis_status(mad) <Figure size ...>

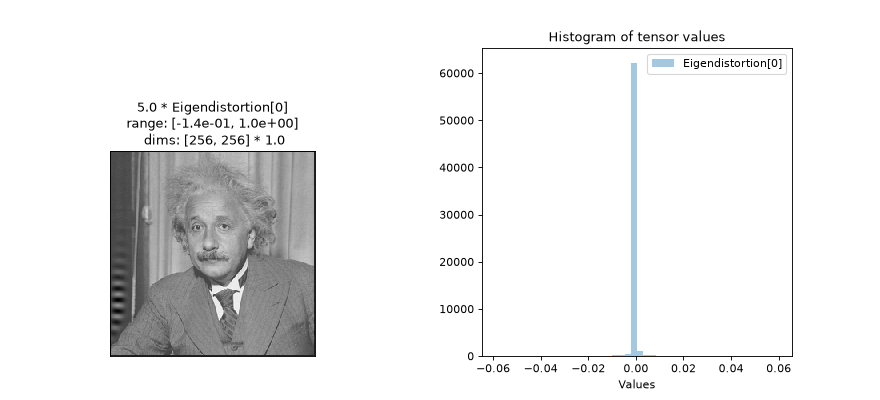
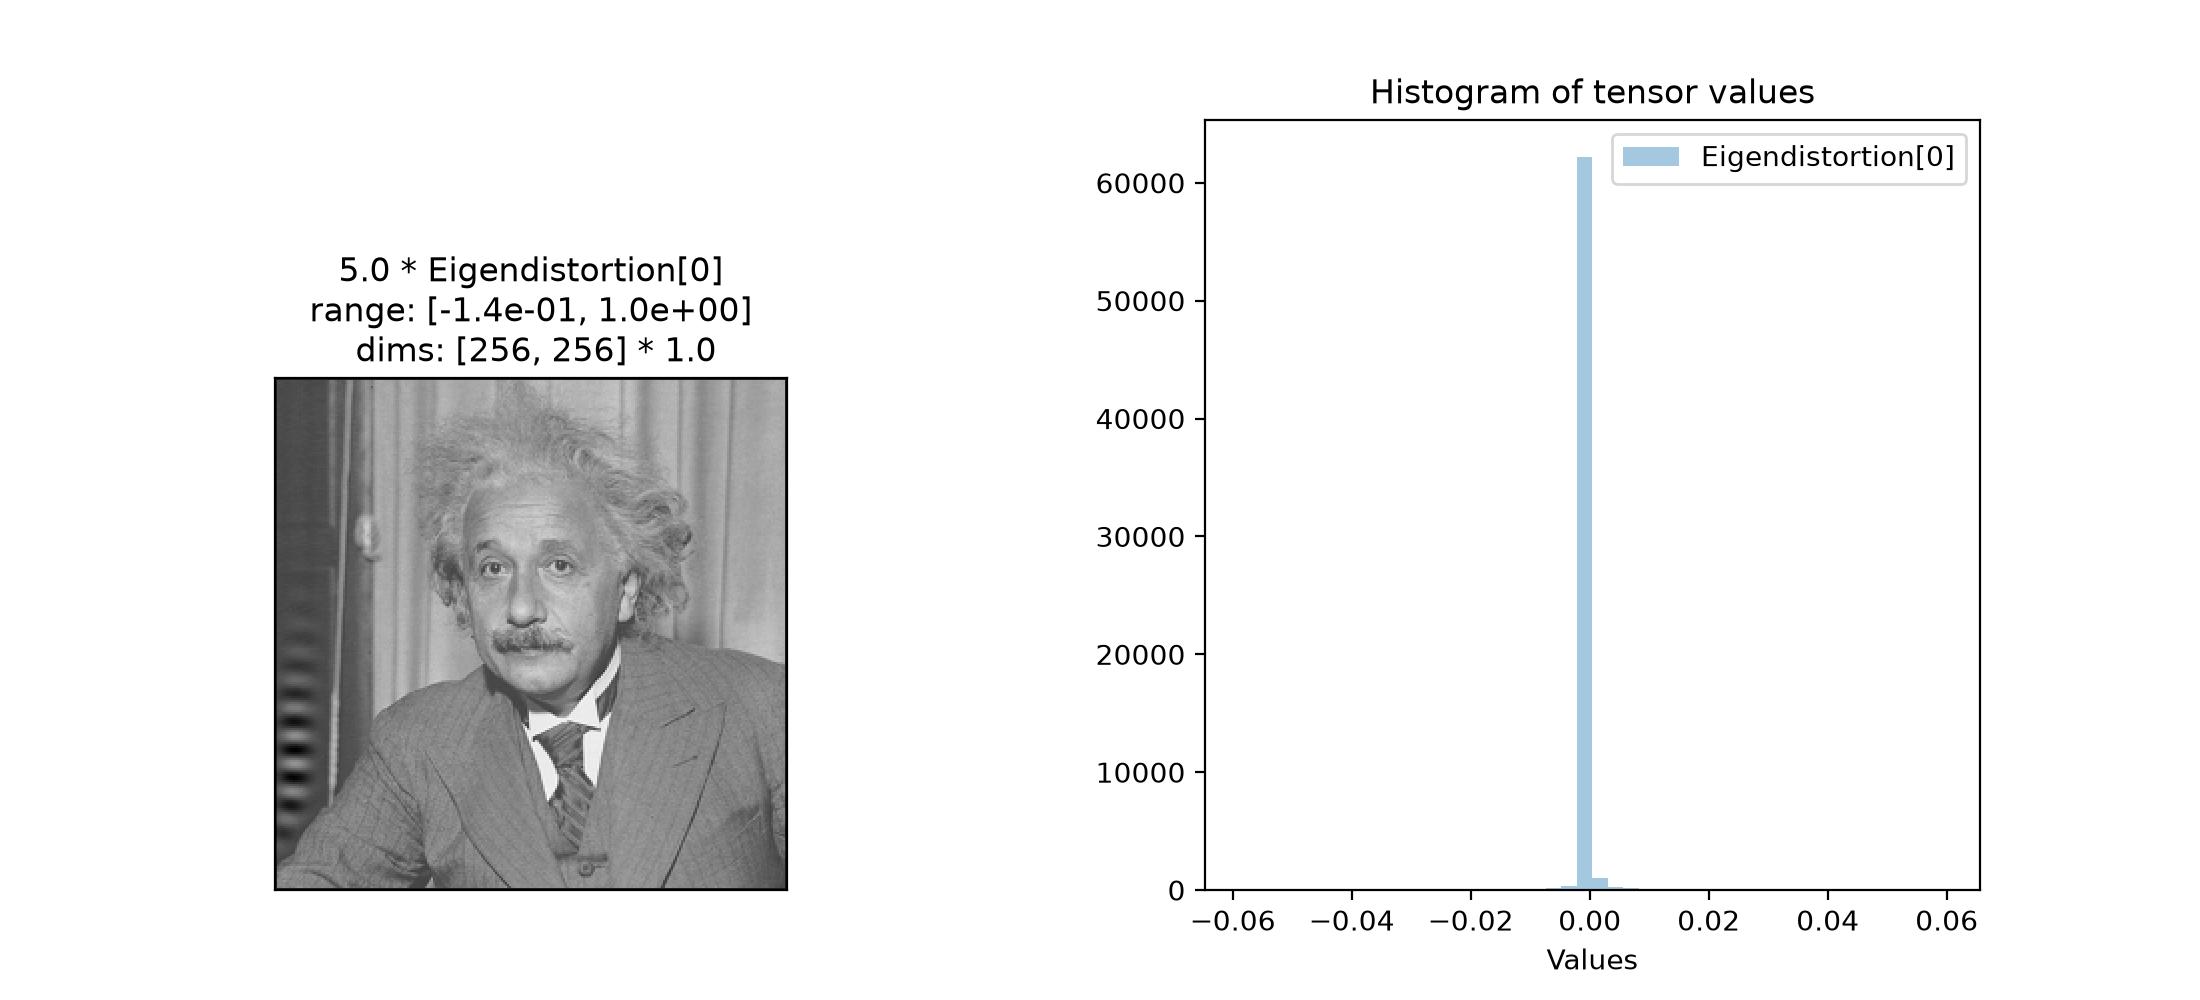
Plot for
Eigendistortionobject. Note the plots are different:>>> img = po.data.einstein().to(torch.float64) >>> lg = po.models.LuminanceGainControl( ... (31, 31), pad_mode="circular", pretrained=True, cache_filt=True ... ).eval() >>> lg = lg.to(torch.float64) >>> po.remove_grad(lg) >>> eig = po.Eigendistortion(img, lg) >>> eig.load( ... po.data.fetch_data("example_eigendistortion.pt"), ... map_location="cpu", ... ) >>> po.plot.synthesis_status(eig) <Figure size ...>
